The model was fine. The labels weren't.
I set out to route support tickets by department. Twenty steps of honest evaluation later, the department labels turned out to be the problem, and the useful model predicted something else.
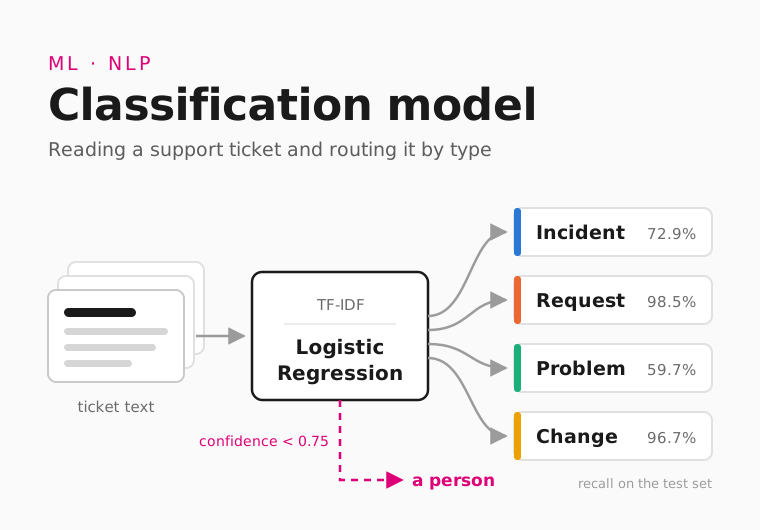
The job is routing, not predicting
A support ticket that lands in the wrong queue costs time twice. Someone has to notice it is wrong, and then someone else has to pick it up late. The goal was simple: read a ticket the moment it arrives and send it to the right place.
The person I built this for is not a data scientist. It is an operations lead who needs two things from a model: route correctly when it can, and hand the ticket to a person when it can't. That second part shaped every decision below. A model that is right 80% of the time but can't tell you which 80% is not something you can put in front of customers.
The data is a public Kaggle set of 28,587 synthetic support tickets, each with a subject, a body, and a department label across ten departments.
Decide what good looks like first
Before training anything, I worked out what a model with no intelligence at all would score. If you always guess the biggest department, Technical Support, you are right 29.3% of the time. Any model has to beat that floor, or it has learned nothing.
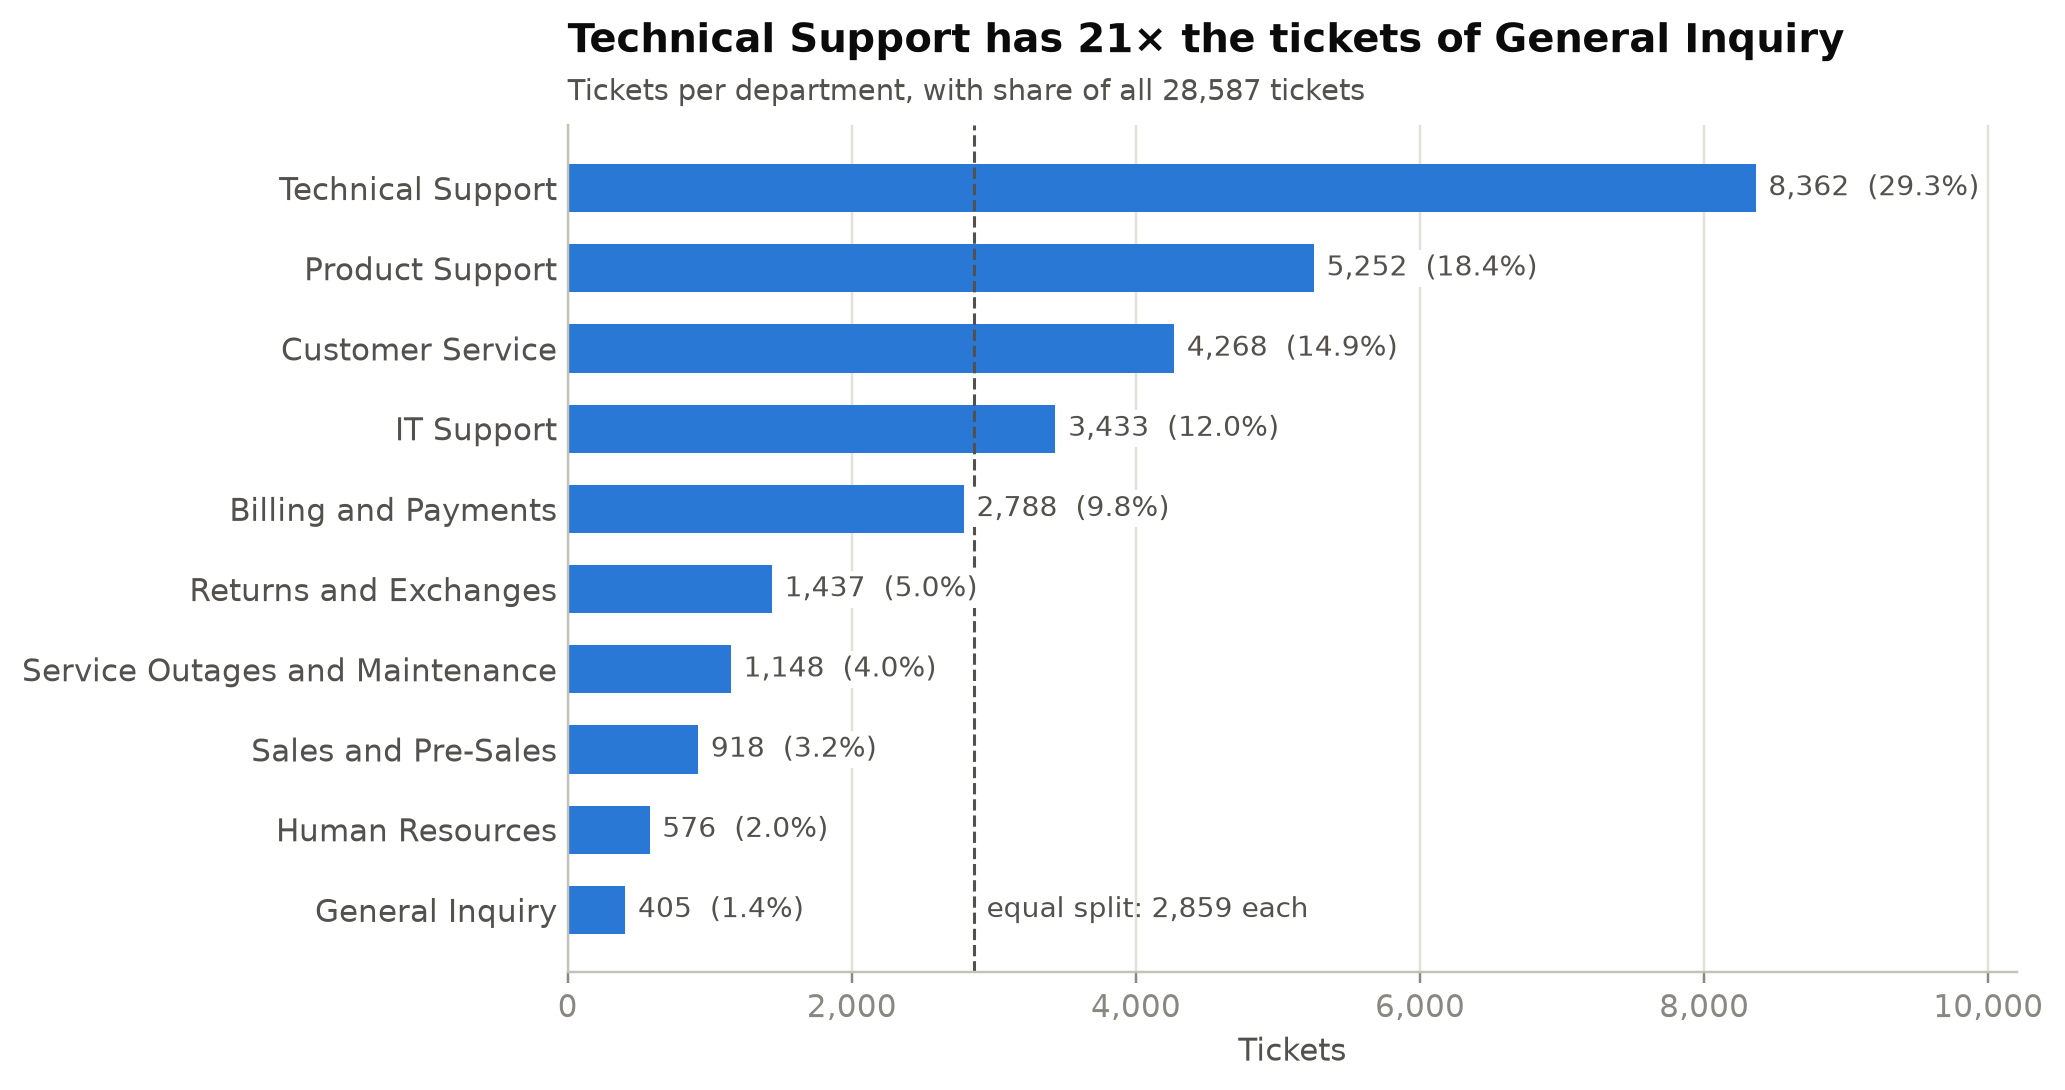 Technical Support has about 21 times as many tickets as General Inquiry. That is why a lazy model can look decent on accuracy alone.
- Accuracy is the share of tickets routed correctly. It is what the operations team feels, so it picks the winner.
- Macro F1 averages performance across departments, so a tiny department counts as much as a huge one. It catches a model that quietly ignores the small queues.
I fixed the rules before seeing any results. Accuracy decides. Every class must be found at least some of the time. Models within one point of each other count as tied, because a one-point gap is inside the noise, and ties go to the higher macro F1. Writing this down first meant I couldn't pick a metric later to flatter whichever model I liked.
What is data leakage, and which columns leaked here?
The dataset has more than text. It also has the agent's reply, a priority, a ticket type and up to eight topic tags. All of those are added after someone has read and handled the ticket. A model that uses them at training time would have nothing to look at in production. Using them would be data leakage: information the model sees in training that won't exist when it is used.
I checked how much they would have helped. Tags, type and priority together lift accuracy about 13 points above the floor. That is real signal, and I excluded it anyway. The model reads only what the customer wrote: the subject and the body.
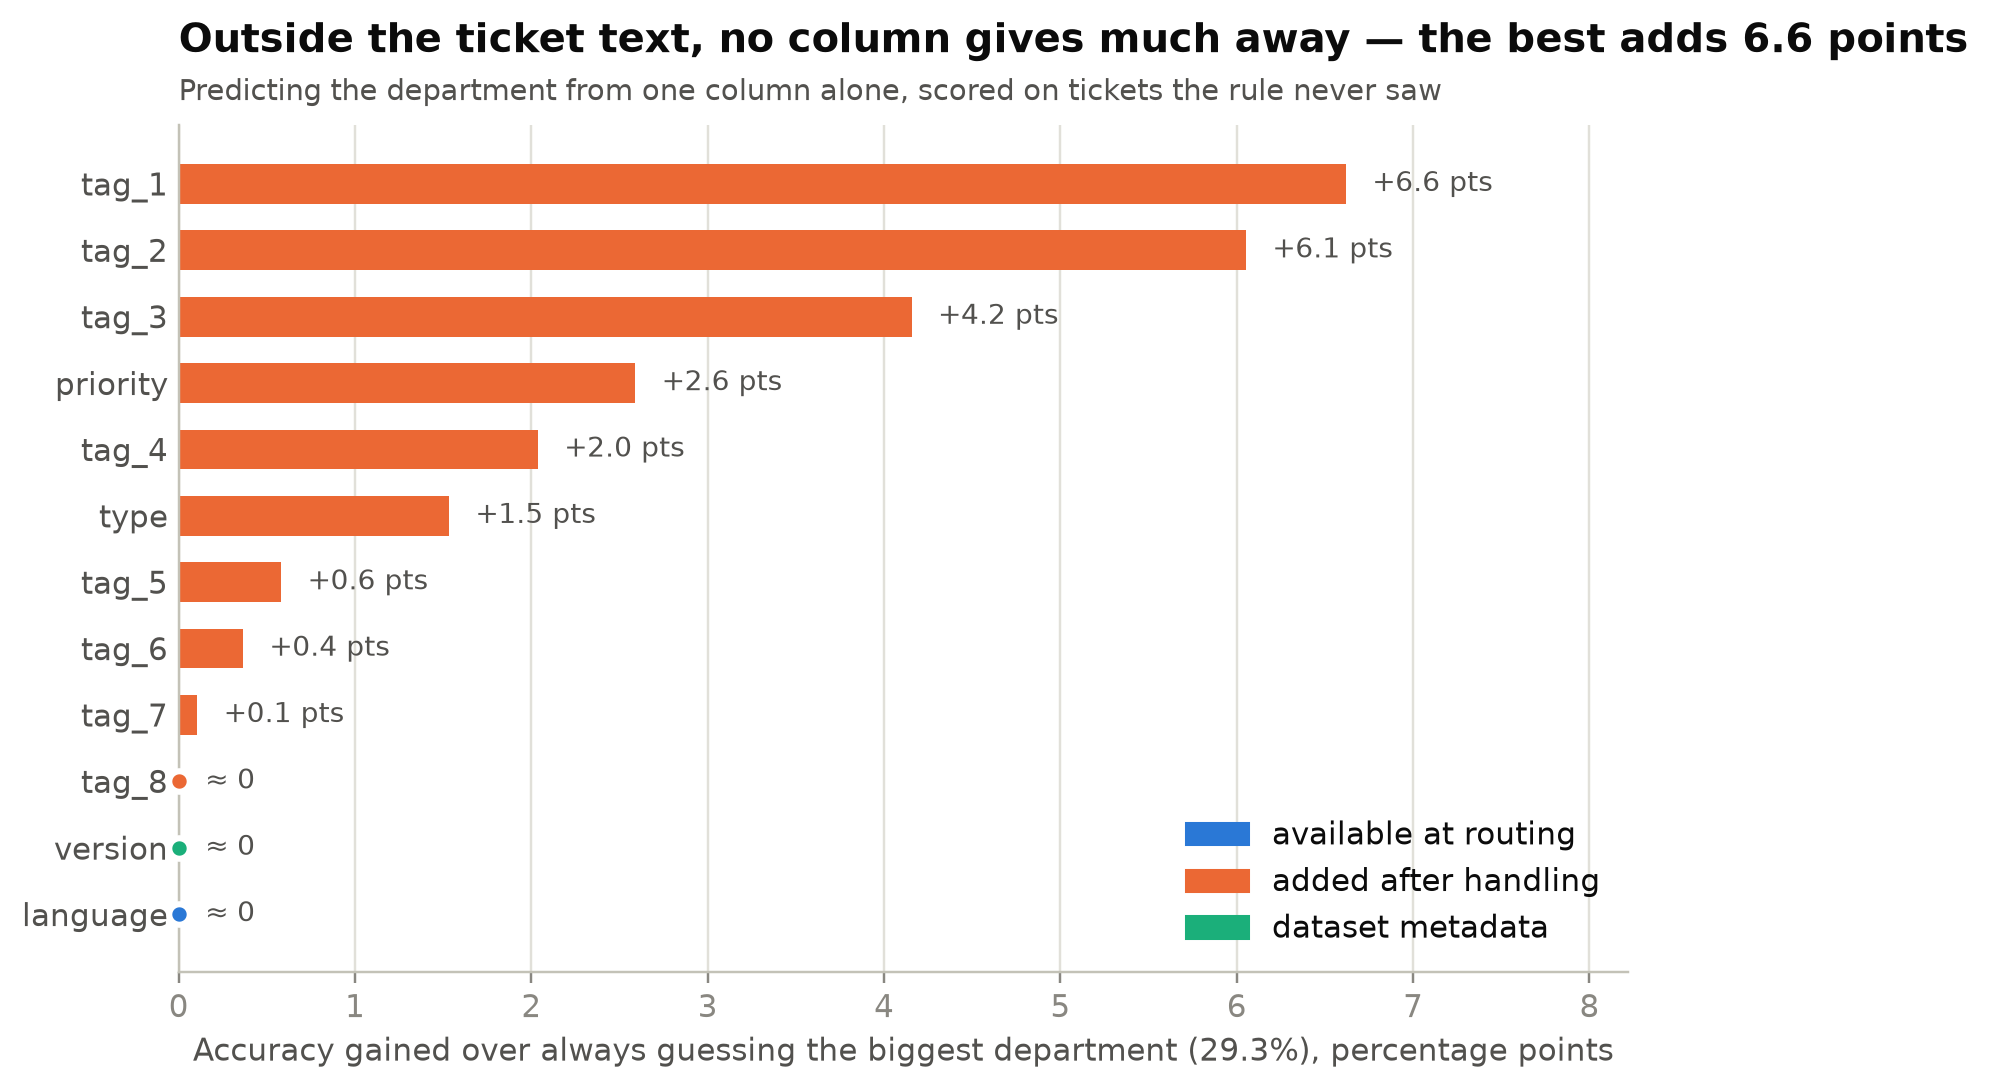 Each column scored alone, on tickets its rule never saw. The colour shows when the column exists in a ticket's life.
Two more scoping decisions, both stated up front:
- The data is synthetic. The results show the method works. They are not a promise about a real inbox.
- English only. I kept the 16,338 English tickets. Every example stays readable, so I can check the model's mistakes myself. It also closes a quieter leak: a German ticket that is a translation of an English one would look unrelated to a word-based check, and could end up on both sides of the split. The cost is that German tickets can't be routed yet.
Why did a random split overstate accuracy by 33 points?
Reading samples, I kept seeing the same ticket twice with slightly different wording. The generator had clearly taken one ticket and reworded it several times, keeping the same label.
That matters because of how models are tested. The usual approach shuffles tickets and holds some back as a test. If one version of a ticket is in training and its reworded sibling is in the test, the model doesn't need to understand anything. It just recognises the ticket.
To find the families, I turned every ticket into a TF-IDF vector (a list of word weights that favours words distinctive to that ticket) and measured how similar each ticket is to its closest neighbour. Tickets above a similarity threshold are linked, and every connected group becomes one family.
# link every pair of tickets above the threshold, then each connected group is a family
links = coo_matrix((ones, (rows, cols)), shape=(n, n))
n_families, family_id = connected_components(links, directed=False)
The threshold was the decision that needed evidence. Too low and unrelated tickets chain together. Too high and real siblings slip through. So I checked, for each level of similarity, how often a ticket's closest neighbour carries the same label.
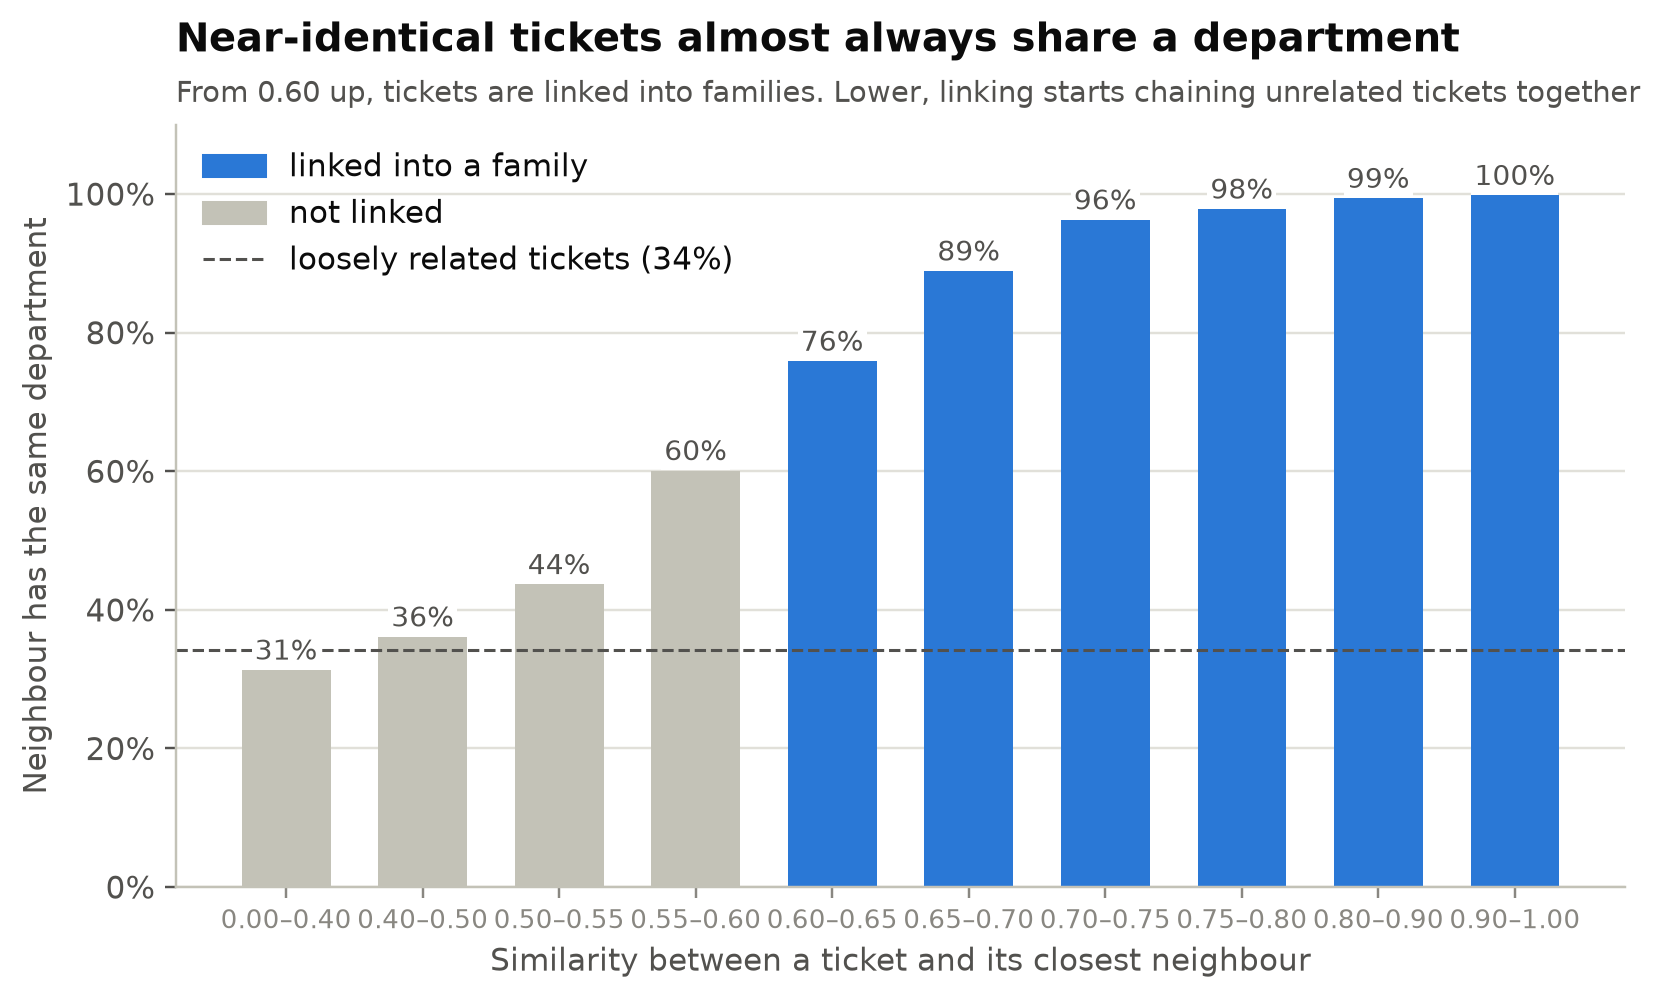 Below 0.5, a ticket's closest neighbour shares its department only about a third of the time: related, not the same ticket. From 0.60 up, agreement climbs from 76% to over 99%. That jump is where I set the threshold.
The result: 16,338 tickets fell into 7,985 families, and 77% of tickets have at least one reworded sibling. From then on, every split kept each family entirely on one side. This is grouped cross-validation, here with scikit-learn's StratifiedGroupKFold: folds are drawn by family, not by ticket, so a reworded sibling can never sit in the test fold while its twin trains.
Here is what that changed. Same model, same training data, only the way it is tested differs:
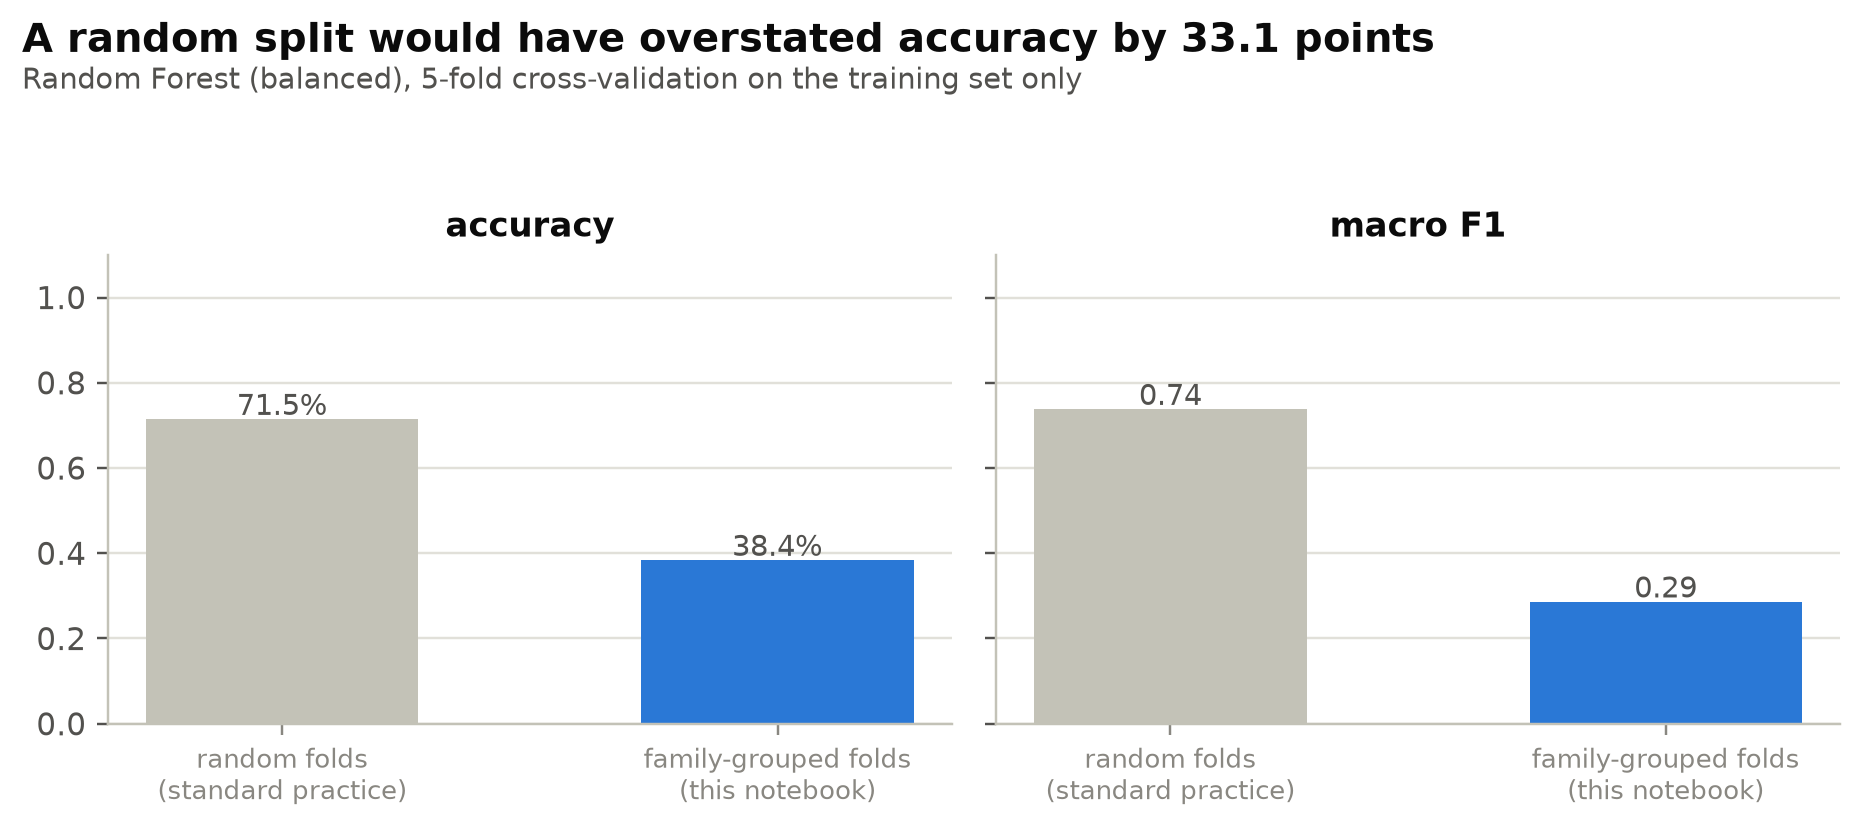 A standard random split reports 71.5% accuracy. Keeping families together gives the honest number: 38.4%.
A 33-point gap, caused only by how the test was built. If I had stopped at the standard split, I would have shipped a department router that looked good and wasn't.
How do you tell when the labels are the problem?
38.4% against a 29% floor is barely a model. The obvious move was to reach for a bigger model. But the evidence was pointing somewhere else.
- The words that best described "Returns and Exchanges" were investment returns. The label was matching a keyword, not the customer's intent.
- A ticket about unauthorised access to medical data sat under Returns and Exchanges.
- Two tickets about the same investment dashboard, almost word for word, were filed under IT Support and Technical Support.
- General Inquiry was almost never found. Two of the seven models never routed a single one correctly.
So I ran a direct test of the label itself. Keep the text, the model and the honest split exactly the same, and change only what the model is asked to predict. If the text were too weak, every target would fail. If the department label were the problem, a different label would work.
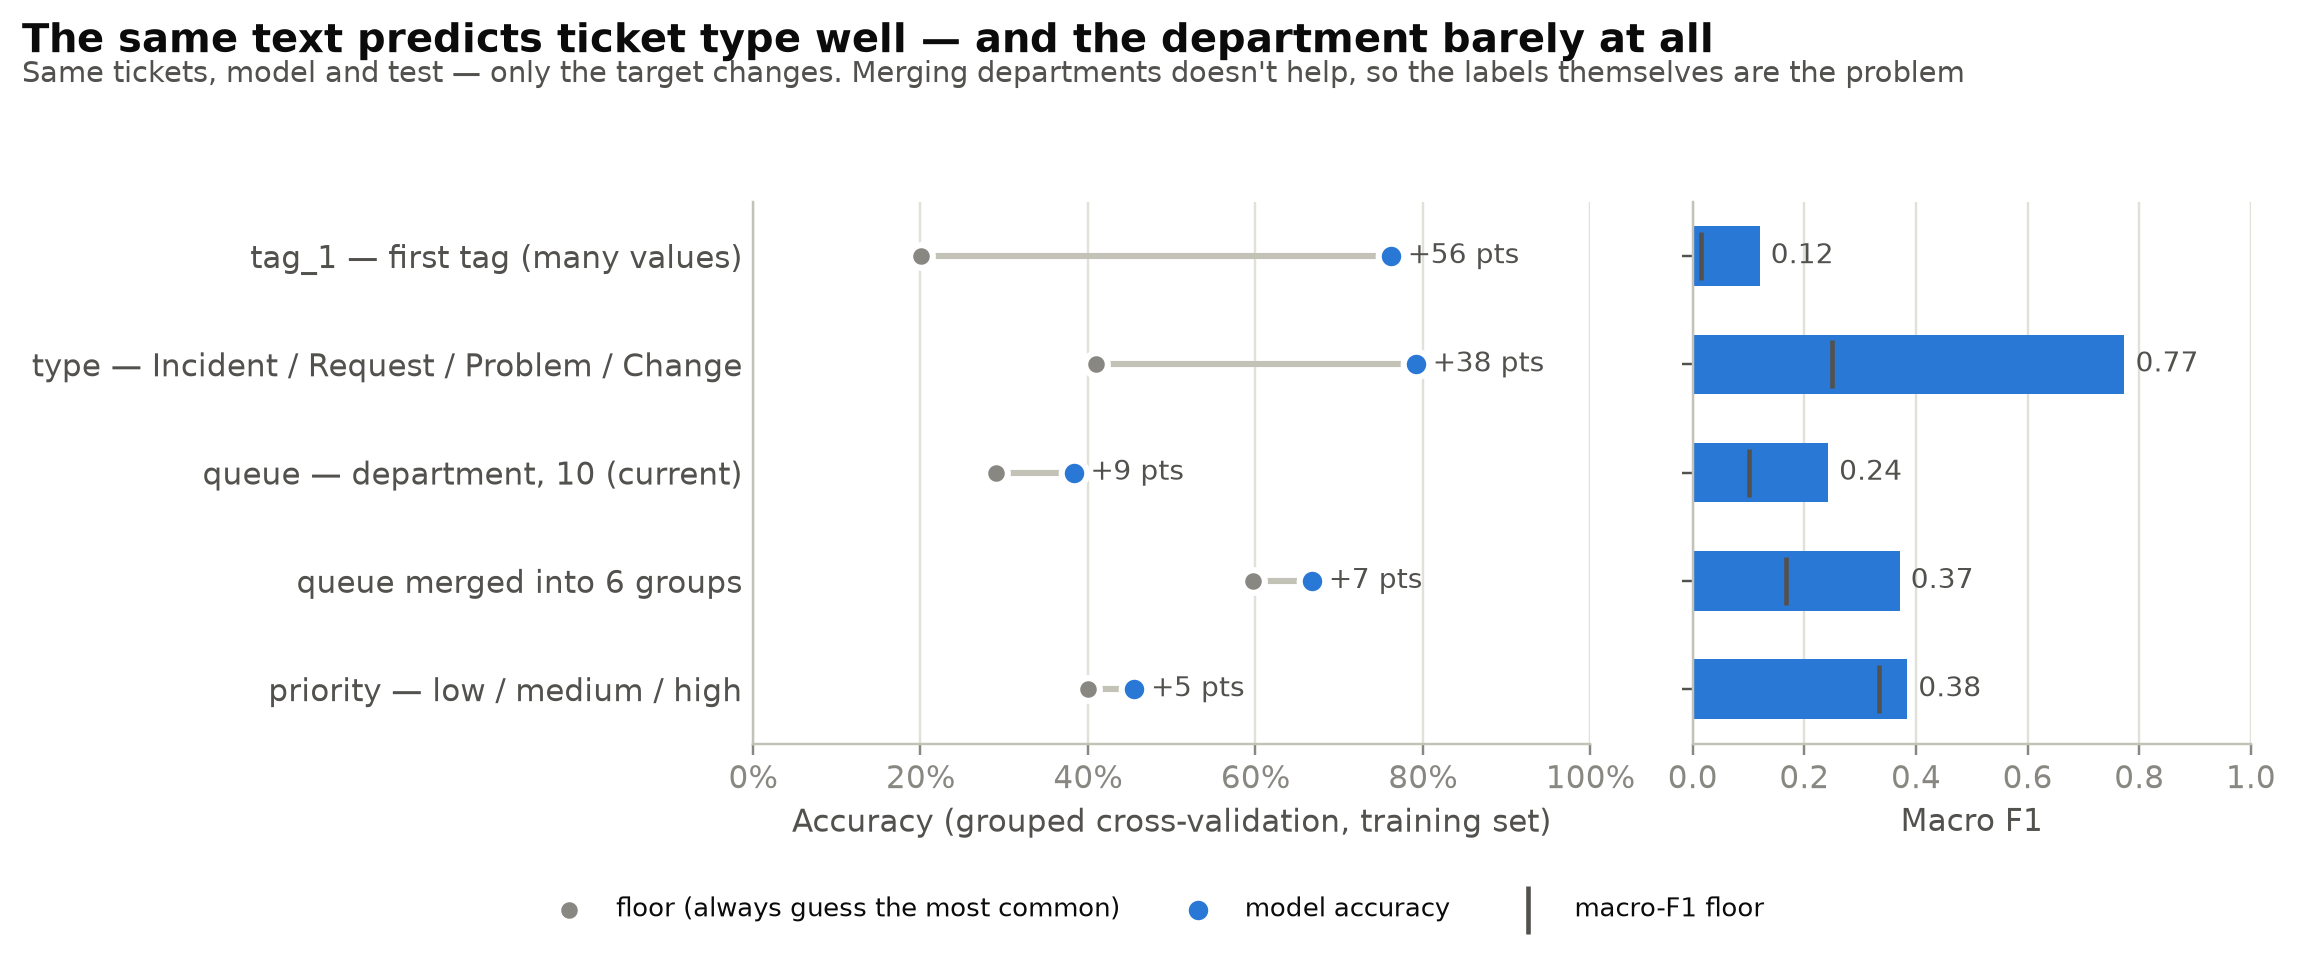 Same text, same model, same split. Only the target changes. Department adds 9 points over its floor. Merging departments into six broader groups adds 7, so the problem isn't that the departments are too fine. Ticket type adds 38.
That settled it. The text carries plenty of signal, and the department labels don't follow it.
I switched the target to ticket type: Incident, Request, Problem or Change. It isn't a consolation prize. These are the standard categories from ITIL, a widely used IT service framework, and each one is a real routing decision. Incidents go to on-call, Requests to the service desk, Changes to change management, Problems to root-cause work. And it is learnable from the text, which department was not.
Type had been banned as an input in the leakage audit. As an output, it is fine. The test set had never been opened, so I re-drew the split balanced by type and carried every other rule over unchanged.
Which model fits sparse ticket text?
I compared seven models, plus the two no-intelligence baselines, all tested on family-grouped folds of the training set only. Each ticket becomes a TF-IDF vector of single words and word pairs, 43,077 features in all. Any one ticket uses only a tiny fraction of them.
That shape is why linear models fit. Logistic Regression adds up many small clues from many words, which suits sparse text where no single word decides. Tree-based models like Random Forest judge a ticket by a handful of individual words, which suits dense data with a few strong columns better than this.
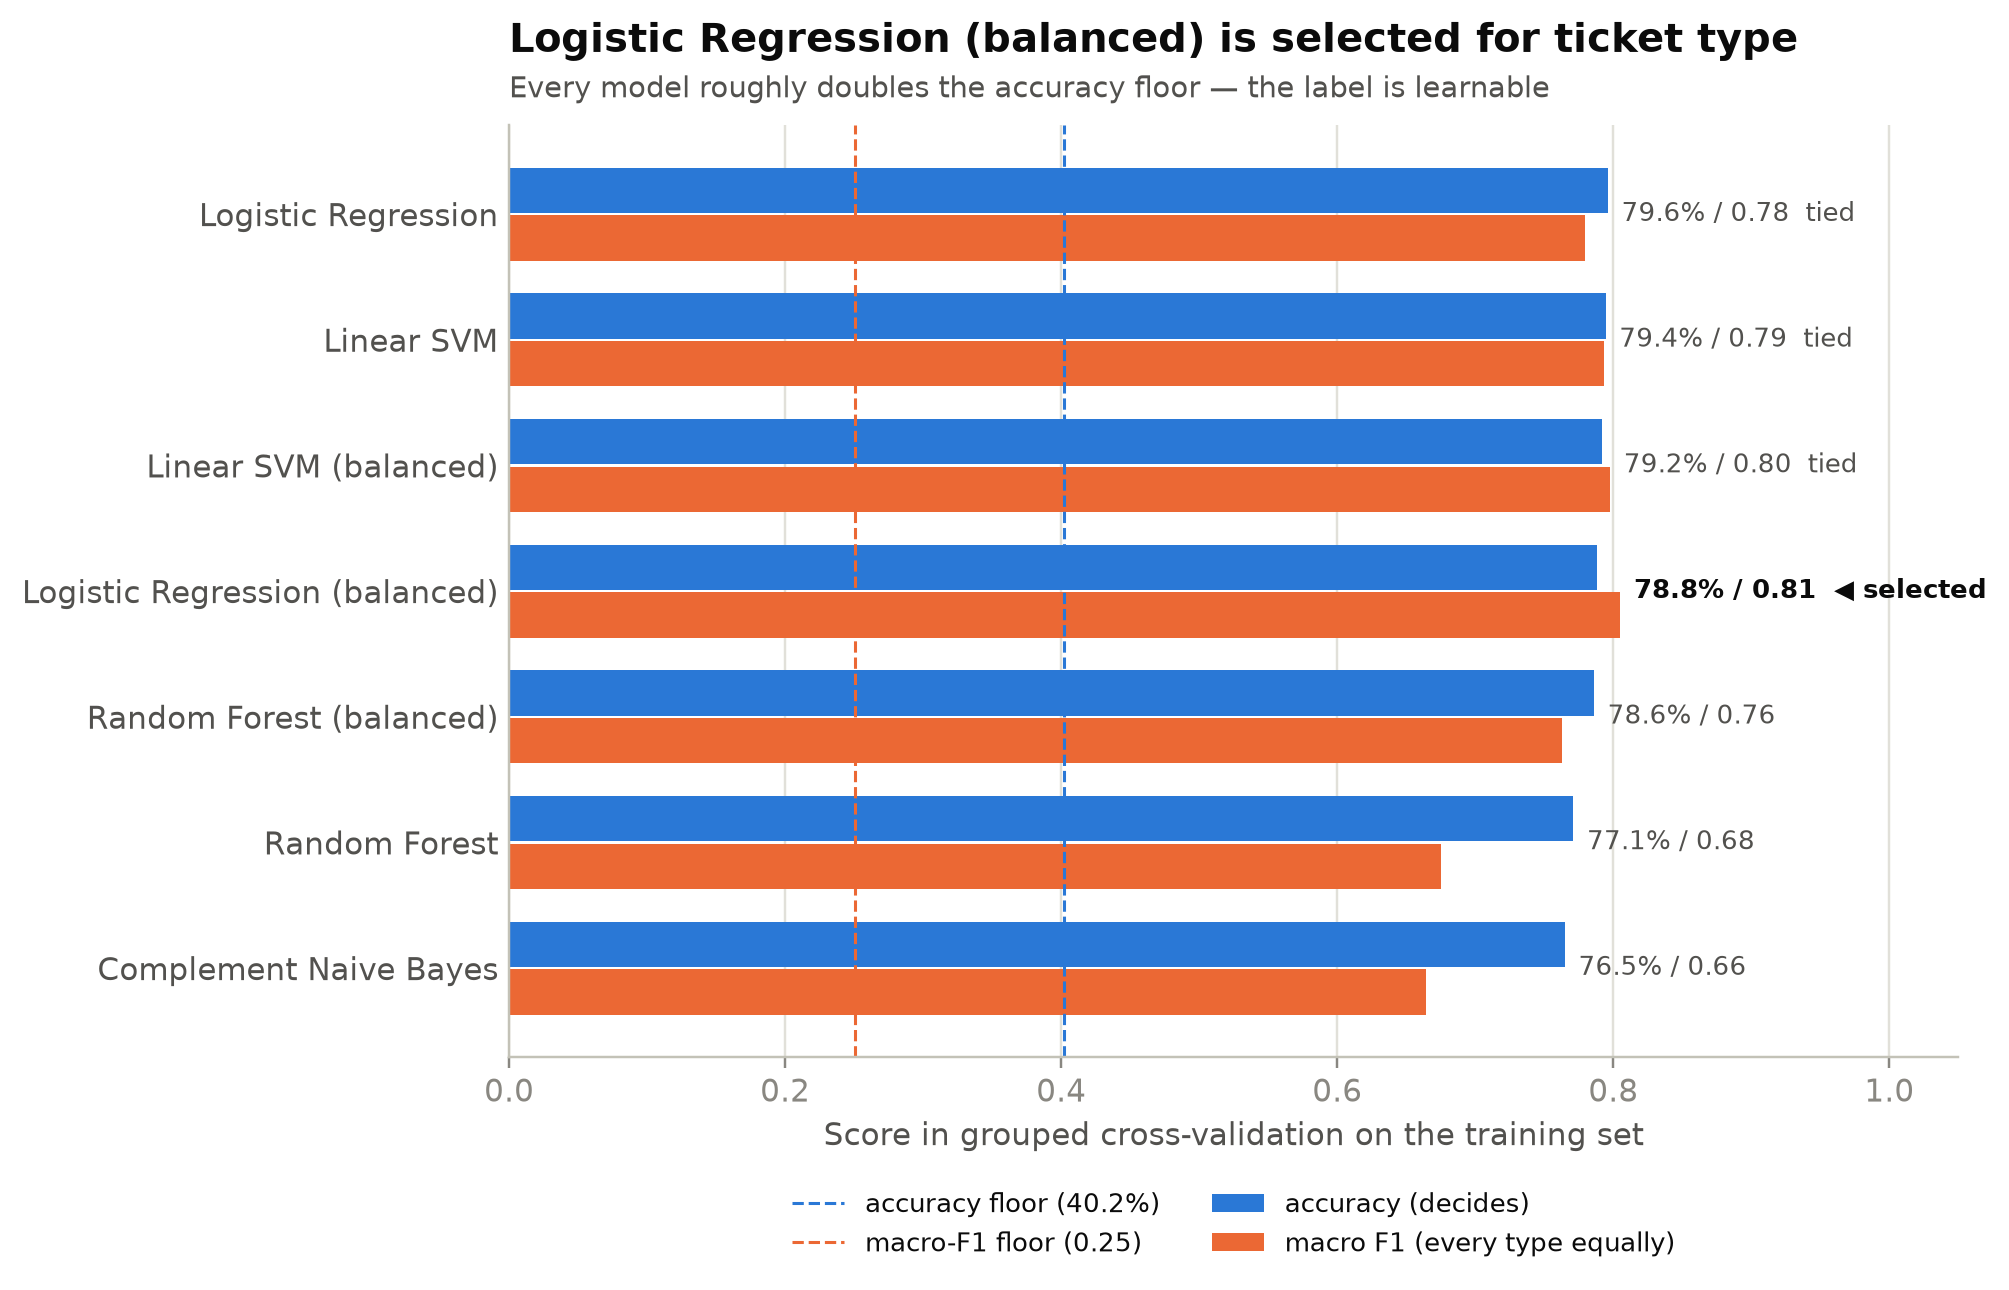 Every model roughly doubles the 40% floor, so the label is learnable. The top linear models land within a point of each other, and the tie-break picks the one that serves every class best.
The results backed that up. Four linear models finished within one point of the best accuracy, which by my rule makes them a tie, so macro F1 decides:
| Model | Accuracy | Macro F1 | Problem recall | Outcome |
|---|---|---|---|---|
| Logistic Regression | 79.6% | 0.780 | 32% | tied |
| Linear SVM | 79.4% | 0.793 | 40% | tied |
| Linear SVM (balanced) | 79.2% | 0.798 | 44% | tied |
| Logistic Regression (balanced) | 78.8% | 0.805 | 57% | selected |
| Random Forest (balanced) | 78.6% | 0.76 | — | just outside the tie |
"Balanced" means mistakes on smaller classes are weighted more heavily. That trade costs under a point of accuracy and finds 57% of Problem tickets instead of 32%. Random Forest came close on accuracy but served the small classes worse. That is the rule doing exactly what it was written for.
Then I tuned it. I tried 30 settings: word versus character features, longer word sequences, how strongly to regularise, and class weights. The best setting changed accuracy by −0.2 points. That is inside the noise, so the simpler baseline stayed. It is an honest ceiling. This kind of bag-of-words model has taken what it can from this data, and a real jump would need a different kind of model.
Can you trust the model's confidence?
An operations lead won't trust a model because it scored 79%. They'll trust it if they can see what it reads, where it fails, and whether its confidence means anything.
What it reads. A linear model shows its reasoning directly, as a weight on each word.
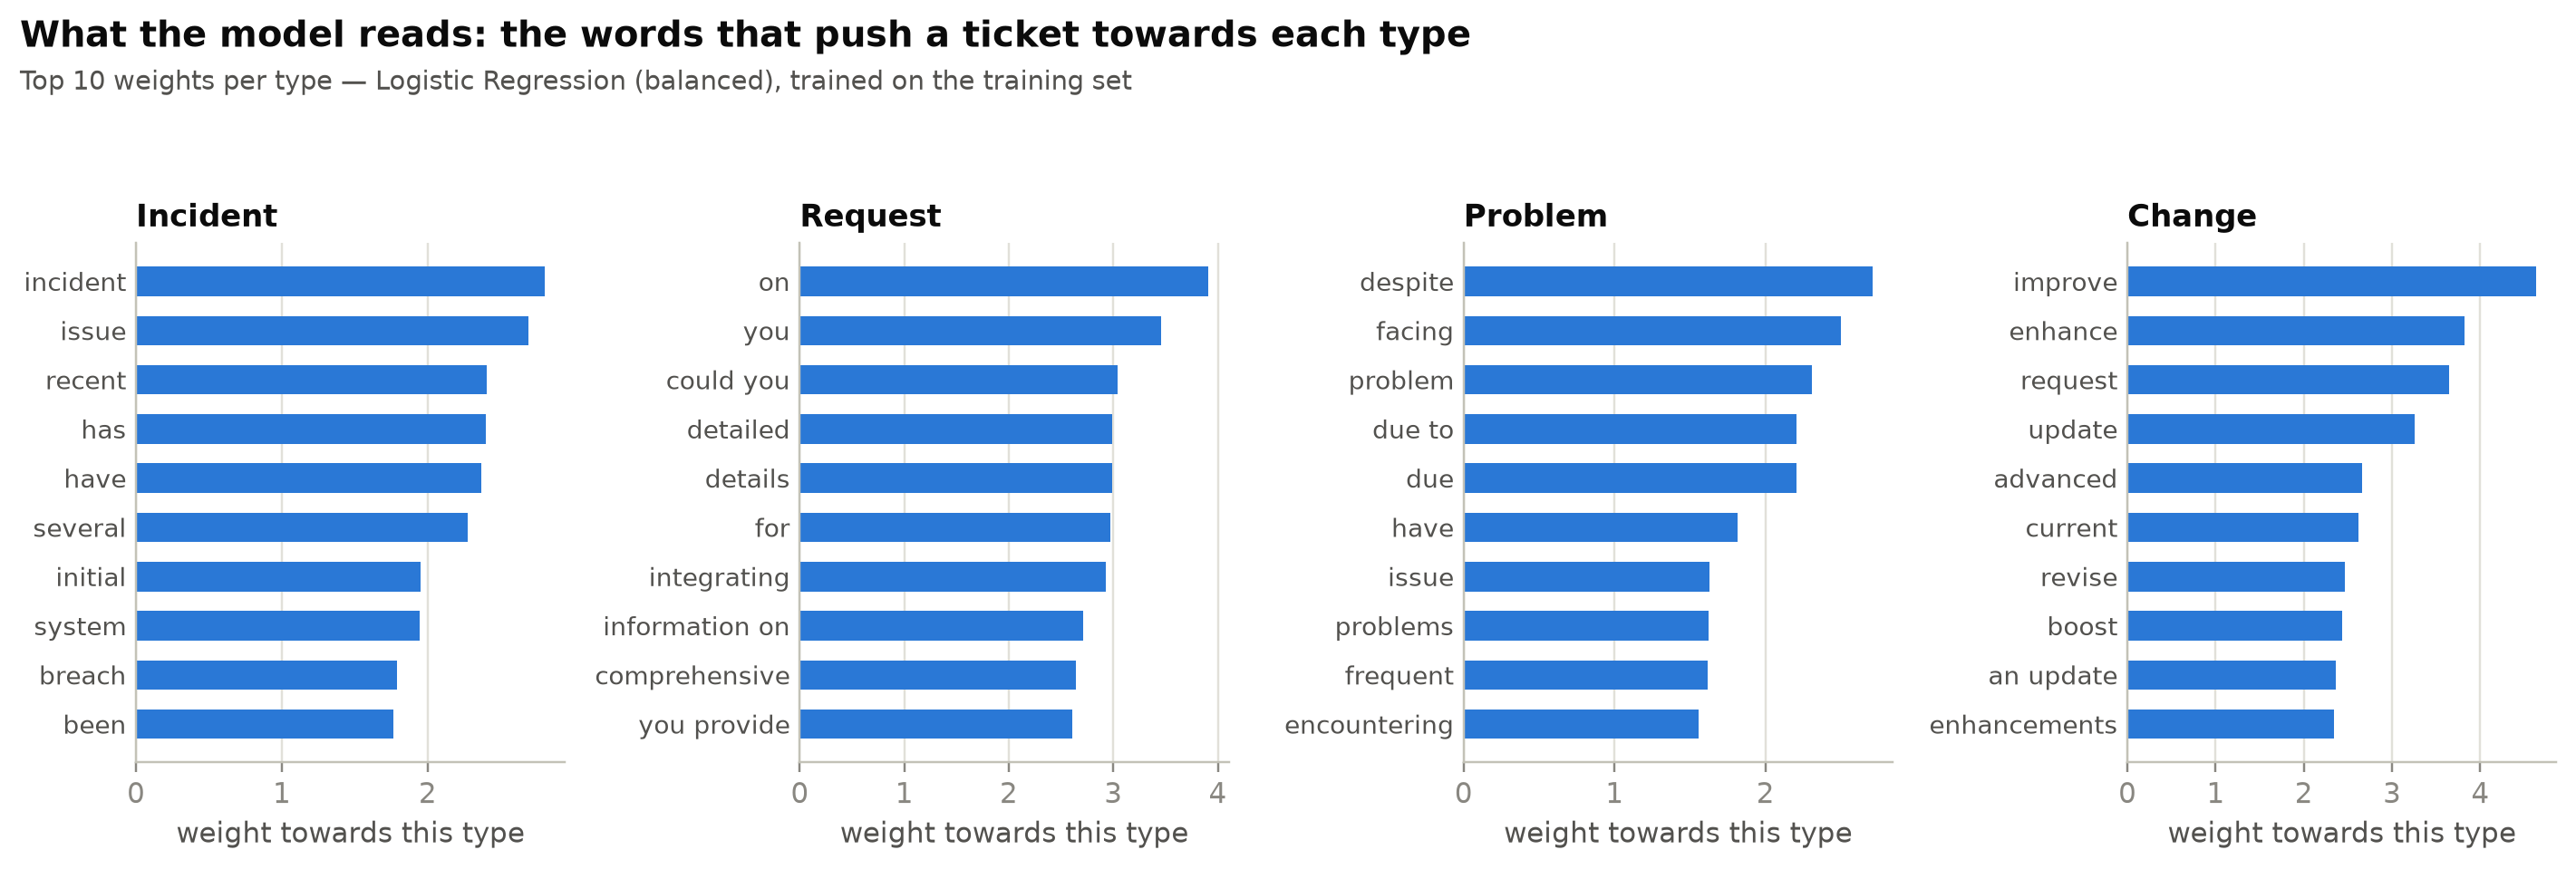 Requests ask ("could you", "information on"). Changes want something better ("improve", "update"). Problems explain a cause ("due to", "despite"). These are the cues a human triager would use.
Where it's wrong. 95% of all mistakes are Incident mixed up with Problem, and on those the model is usually unsure, with a median confidence of 58%.
When I read the confused tickets, the labels themselves are inconsistent: a hospital data breach is an Incident in one place and a Problem in another. Only 0.9% of training tickets are ones the model contradicts with 80% or more confidence, so the type labels are far cleaner than the department labels were. Short tickets are also harder: 69% accurate at ten words or fewer, against about 80% overall.
Can its confidence be trusted? I checked whether "80% sure" means right 80% of the time.
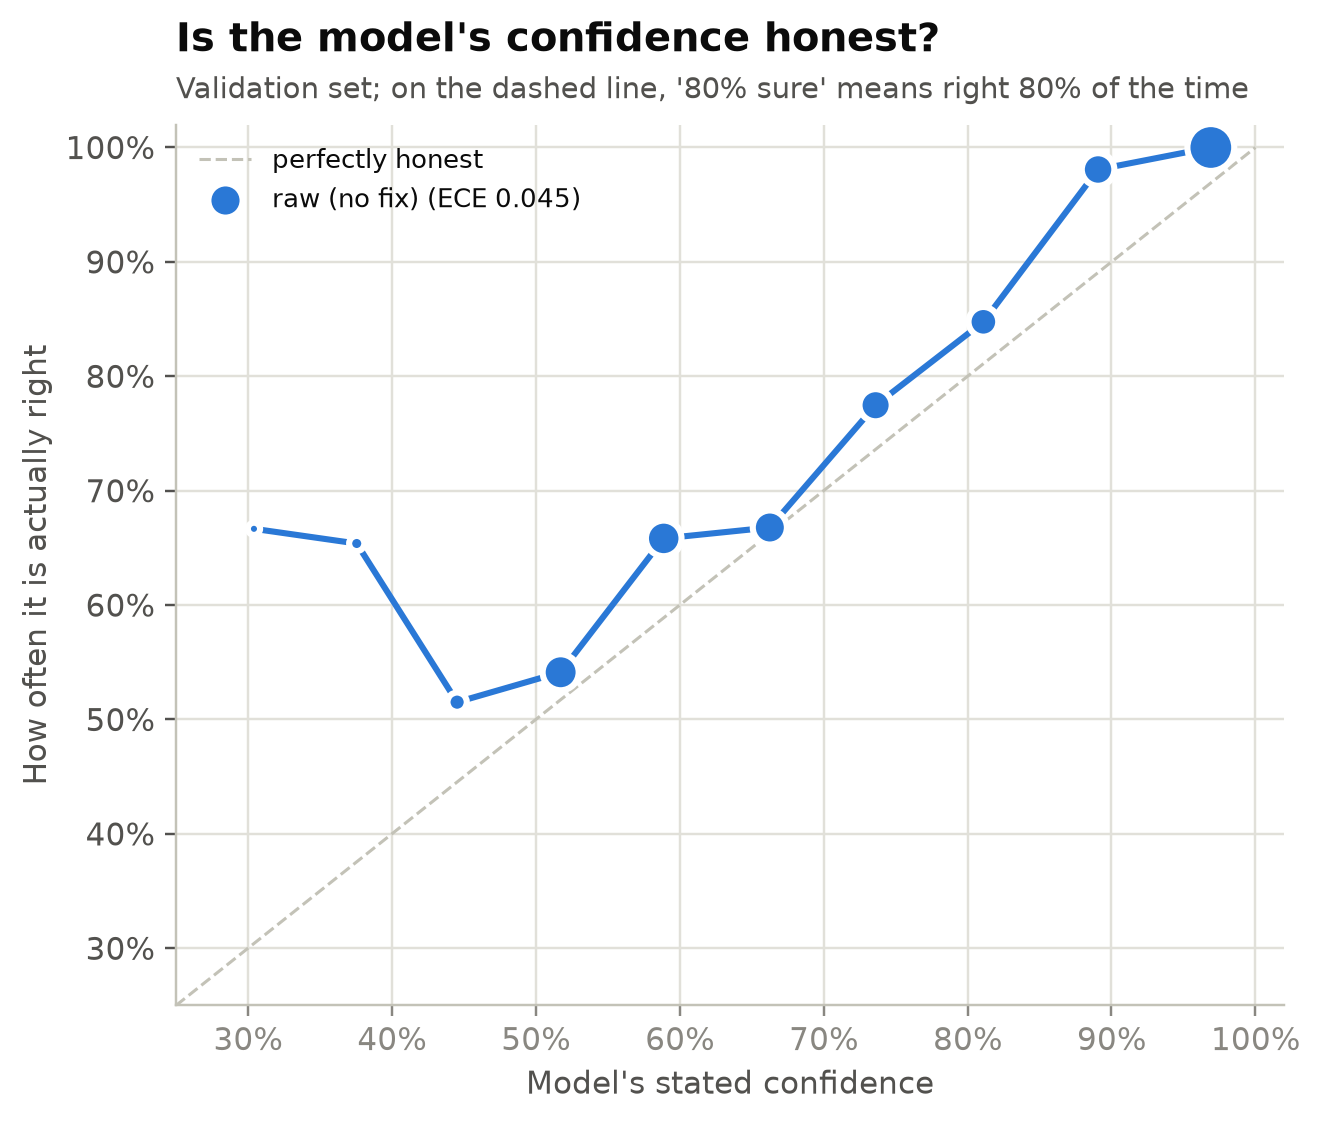 The line sits slightly above the diagonal. When the model says 80%, it is right about 85% of the time.
The model is slightly under-confident, which is the safe direction for routing. I tested two standard calibration fixes. Each improved one measure and worsened the other, and my rule was to keep a fix only if it improved both. So the raw probabilities stayed.
The product decision. With trustworthy confidence, the model can decide when to hand off. I set a 95% accuracy target for tickets routed without a person, then found the lowest confidence threshold that meets it.
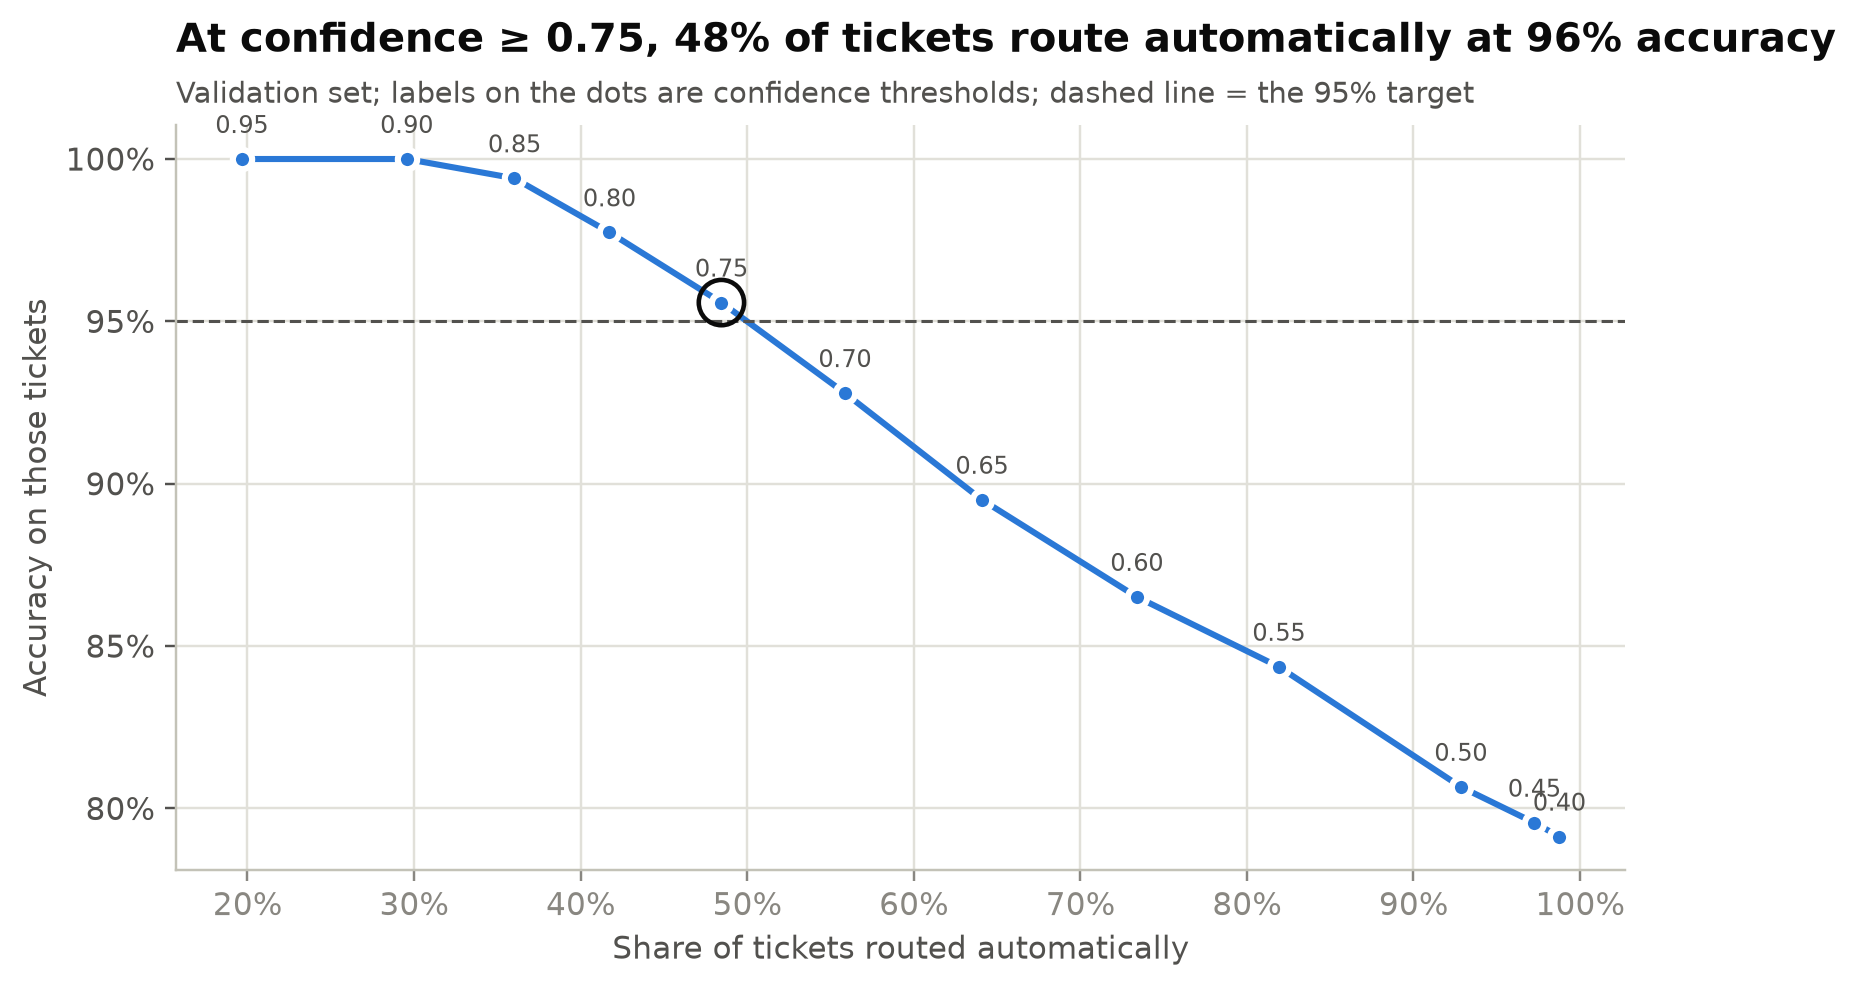 Each point is a confidence threshold. At 0.75, about half the tickets route automatically at 95–96% accuracy.
At confidence 0.75 or higher, the ticket routes itself. Everything else goes to a person, and those are mostly the ambiguous Incident-or-Problem tickets, which are exactly the ones a human should look at.
What did the final test show?
The test set stayed sealed until the very end, and I opened it once, with the model and threshold exactly as validated. To get a range rather than a single number, I resampled whole families 1,000 times. Resampling single tickets would let near-duplicates make the range look tighter than it really is.
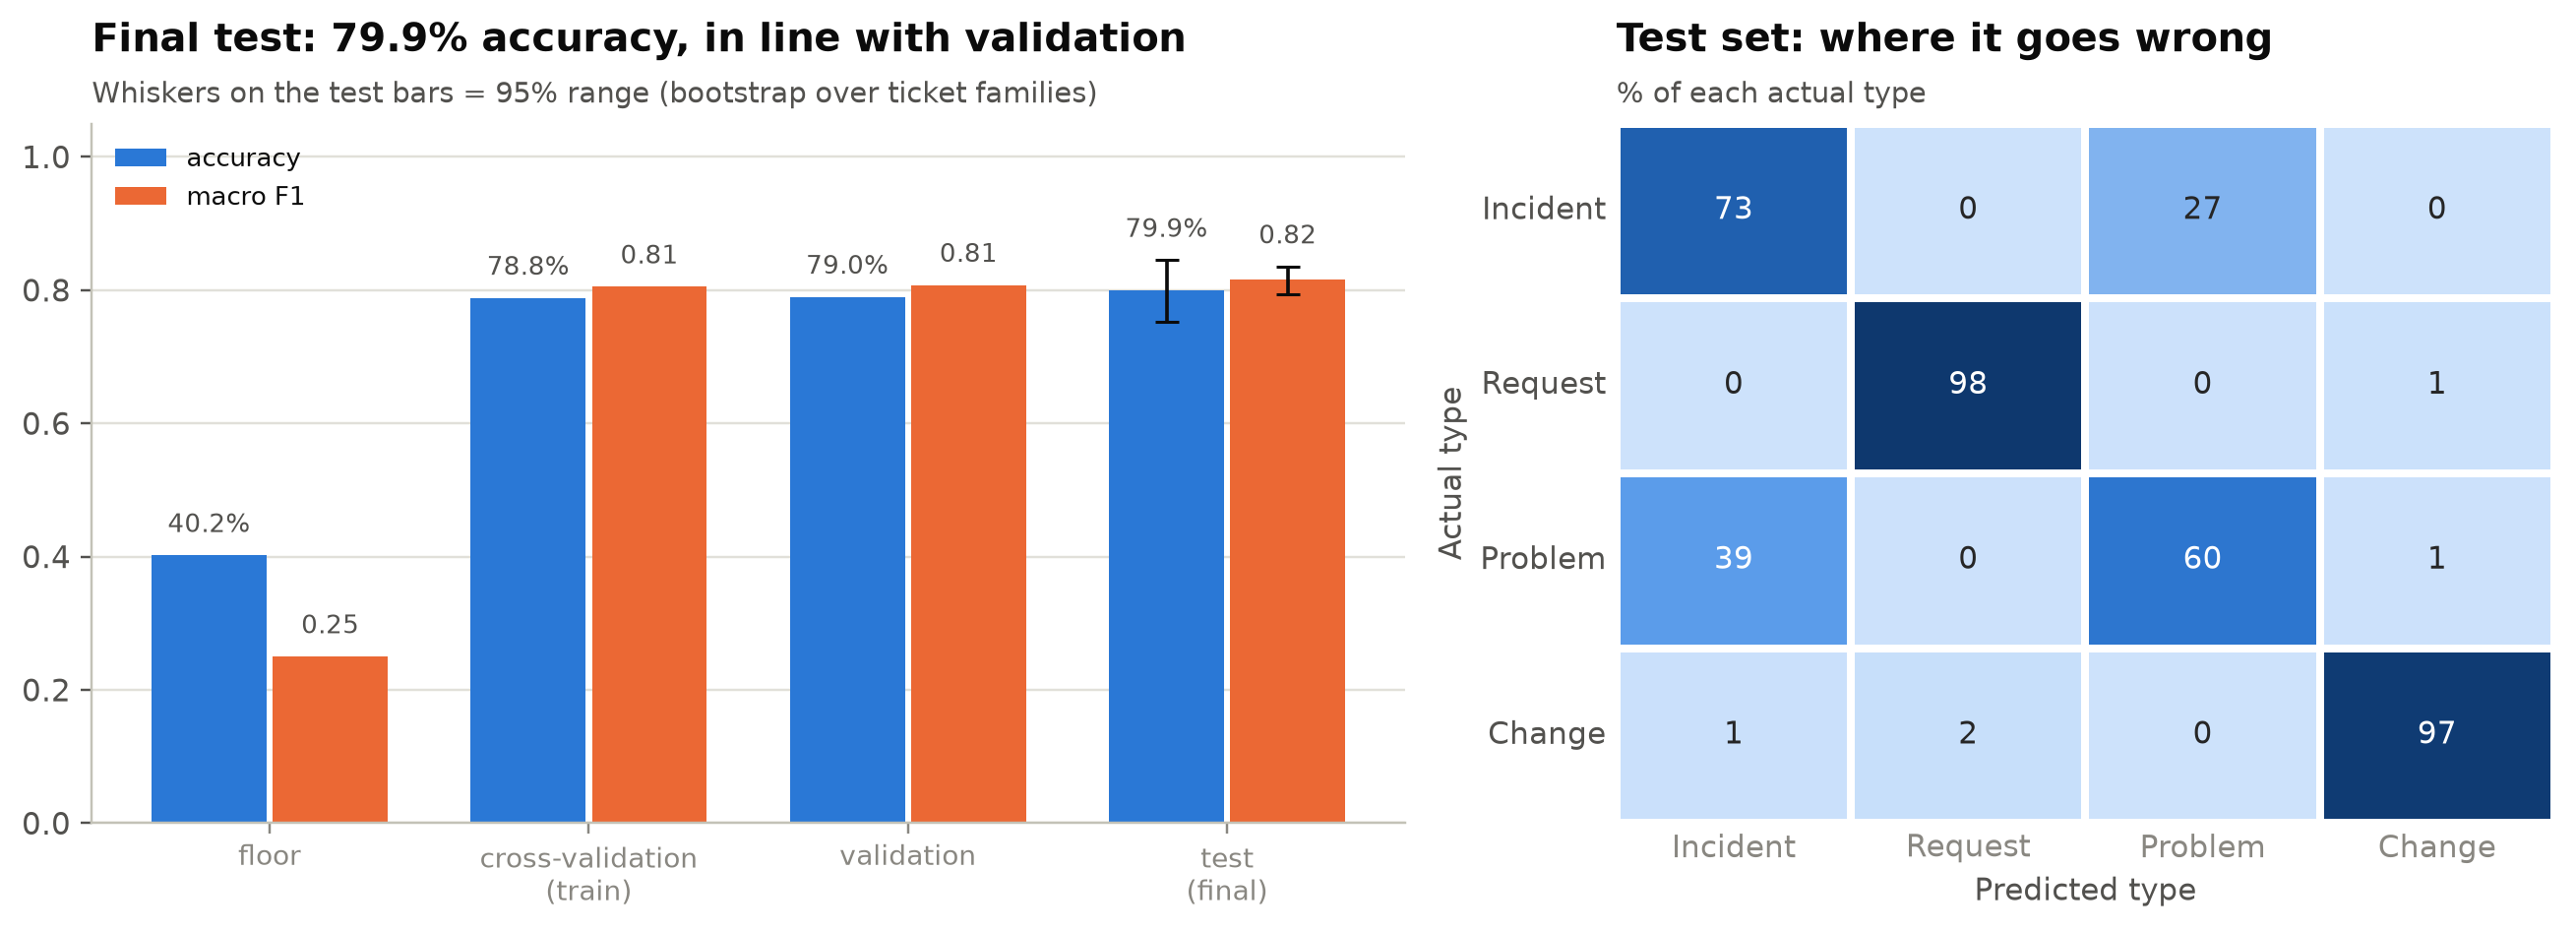 Cross-validation 78.8%, validation 79.0%, test 79.9%. The three agree, so the evaluation held.
| Result | Floor | |
|---|---|---|
| Accuracy | 79.9% (95% range 75.2–84.5%) | 40.2% |
| Macro F1 | 0.815 (0.794–0.835) | 0.250 |
| Auto-routed at ≥ 0.75 | 46% of tickets, 96.4% accurate | none |
Recall by type: Request 98.5%, Change 96.7%, Incident 72.9%, Problem 59.7%.
What it cannot do yet
I saved the model with a model card that states its limits next to its scores:
Next, I want to add German using family detection that works across languages, and to compare a sentence-embedding model on the same grouped test. That is the obvious way past the bag-of-words ceiling.
What this taught me
The model was never the hard part. Logistic Regression was working fine by step 15. The work that mattered was finding out what the data could honestly support, and building something that is clear about where its knowledge ends.
Frequently asked questions
Why did a random split give 71.5% but a grouped split 38.4%?
77% of tickets have a reworded sibling: 16,338 tickets fell into 7,985 families. In a random split, a ticket's twin sits in training, so the model only has to recognise it. Keeping each family on one side of the split removes that shortcut and gives the honest 38.4%.
What is macro F1, and why track it?
Macro F1 averages performance across classes, so a small class counts as much as a large one. I track it next to accuracy to catch a model that ignores the small queues. Accuracy picks the winner, and macro F1 breaks ties between models within one point.
Which model won, and why?
Logistic Regression with balanced class weights, on TF-IDF features of single words and word pairs (43,077 features). It scored 78.8% in cross-validation and 0.805 macro F1, and it found 57% of Problem tickets against 32% without the weights. Three other linear models tied it on accuracy, so macro F1 decided. Tuning 30 settings moved accuracy by −0.2 points, so I kept the simple baseline.
Is the data real?
No. It is a public Kaggle set of synthetic support tickets, and I kept the 16,338 English ones. The results show the method works. A real inbox needs revalidation before anyone relies on the model.
How does the auto-routing work?
A ticket whose top confidence is 0.75 or higher routes itself, and everything else goes to a person. On the test set that was 46% of tickets at 96.4% accuracy. The rest are mostly ambiguous Incident-or-Problem tickets, which a human should read.
Which tools did I use?
Python, scikit-learn for TF-IDF, Logistic Regression and grouped cross-validation, and SciPy to find the connected groups of near-duplicate tickets.
What would I do next?
Add German using family detection that works across languages, and compare a sentence-embedding model on the same grouped test. That is the obvious way past the ceiling of a bag-of-words model.