What do Premier League teams have to learn from Leicester 2015/16?
I valued every on-ball action of the 2015/16 Premier League with a standard public method. It explained the season well, except for the team that won it.
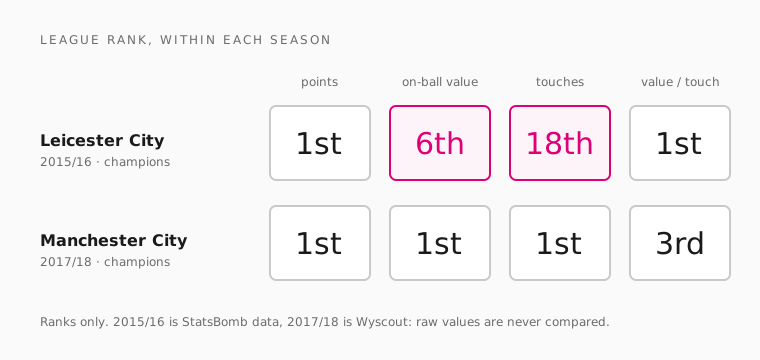
Leicester City won the 2015/16 Premier League. They took 81 points, ten more than Arsenal. They scored 68 and conceded 36.
I built a model that puts a value on every touch of the ball that season. All 758,434 of them. Then I asked it which team added the most.
It said Arsenal. Leicester came sixth.
The model isn't broken. It ranks the rest of the league close to the real table. It also gets a lot right about how Leicester played. But there's a gap between sixth and first that it can't close. This post walks through how I built it, phase by phase, and what that gap says about the parts of football data never sees.
What does a normal champion look like in the data?
I needed a reference first. A champion the model should understand.
Manchester City in 2017/18 is that team. They won with 100 points. In that season's model they rank first on points, first on total value, and first on touches. When a team dominates the ball and the table, the model agrees with the table.
The chart at the top shows both champions side by side. It compares ranks only, never raw values. The two seasons come from different data providers, and each provider counts actions differently.
Leicester's ranks disagree with each other. First on points. Sixth on value. Eighteenth on touches. First on value per touch. The rest of this post is about why.
How I built it, phase by phase
The method is called VAEP: Valuing Actions by Estimating Probabilities. It asks one question of every on-ball action. Did it make a goal for your team more likely, and a goal against you less likely?
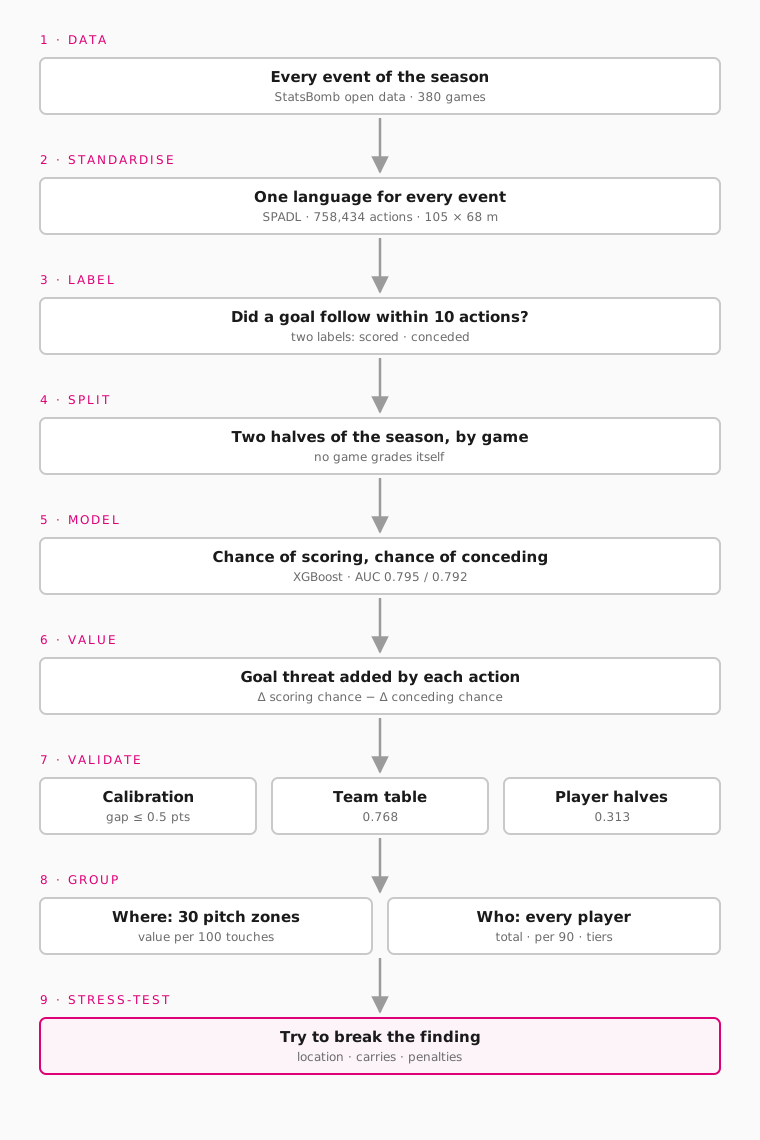 Nine phases. Each one exists to stop a specific mistake.
Phase 1: Get every event of the season
The data is StatsBomb's open data. It covers all 380 Premier League games of 2015/16. Every pass, shot, tackle and carry is logged, with where it started and where it ended.
I picked one full season from one provider. Every team gets the same coverage, so the comparison between teams is fair.
Phase 2: Put every event in one language
Each data provider describes events its own way. That makes raw data awkward to model.
So I converted every event to SPADL, a standard format for football actions. Each action becomes one row: what it was, who did it, where it started and ended on a 105 × 68 metre pitch, and whether it worked. That gave 758,434 actions.
Standardising first is what let me reuse the whole pipeline later. When I added the 2017/18 seasons from a second provider, I only needed a new reader for it. The labels, the model and the checks stayed the same.
Phase 3: Decide what "valuable" means
A model can't value an action until it knows what usually follows it. So every action gets two labels:
- Did the team score within the next 10 actions?
- Did the team concede within the next 10 actions?
Ten actions is the window. It's long enough for a move to develop, and short enough that the goal is still connected to the action.
The model reads the game state around each action: where the ball is, what kind of action it was, whether it worked, and the two actions before it.
Phase 4: Stop the model marking its own homework
Actions within one match are closely linked. If the model learned from a game and then rated that same game, its ratings would look better than they really are.
So I split the season in two, by game. Games alternate by date into two halves. The model trained on one half rates the other half, and then they swap. Every action is valued by a model that has never seen its game.
Phase 5: Train the model
For each action, the model estimates two chances: that the team scores soon, and that it concedes soon.
It uses gradient-boosted trees (XGBoost), the standard learner for VAEP. I kept the standard learner on purpose. The interesting question here is what the values say, not whether a fancier model could squeeze out a bit more accuracy.
Phase 6: Turn chances into a value
An action's value is how much it moved those two chances:
value = (change in chance of scoring) − (change in chance of conceding)
A typical action is worth about ±0.01. A shot that goes in is worth far more. A loose pass in your own half that leads to a chance against is worth less than zero.
Attack and defence end up on one scale. That's what lets a tackle and a through-ball be added up together.
Phase 7: Check the model before trusting it
A value is only worth reading if the model behind it holds up. I fixed three checks before I looked at a single team.
| Check | The question | Result |
|---|---|---|
| Calibration | When the model says "2% chance of a goal", do goals follow about 2% of the time? | Largest gap: 0.5 percentage points. AUC 0.795 for scoring, 0.792 for conceding |
| Team table | Does ranking teams by total value match the real table? | Rank correlation 0.768 (1 would be identical) |
| Player halves | Is a player's value per 90 similar in both halves of the season? | Rank correlation 0.313, across 293 players |
The first two say the model is sound. Its error is about 17% lower than always guessing the average goal rate, and it ranks teams close to the real table.
The third is the honest limit. Player values carry a real signal, but a weak one. So player rankings are tiers (top, middle, bottom), never exact places.
The team check is also where Leicester first showed up. 0.768 is strong, but not perfect. The champions are one of the teams it misses.
Phase 8: Group the values by where, and by who
Every action now has a value. The dashboard groups them two ways.
Where: the pitch is cut into 30 zones. Each zone shows how dangerous a typical touch there was, and how that compares with the league average in the same zone.
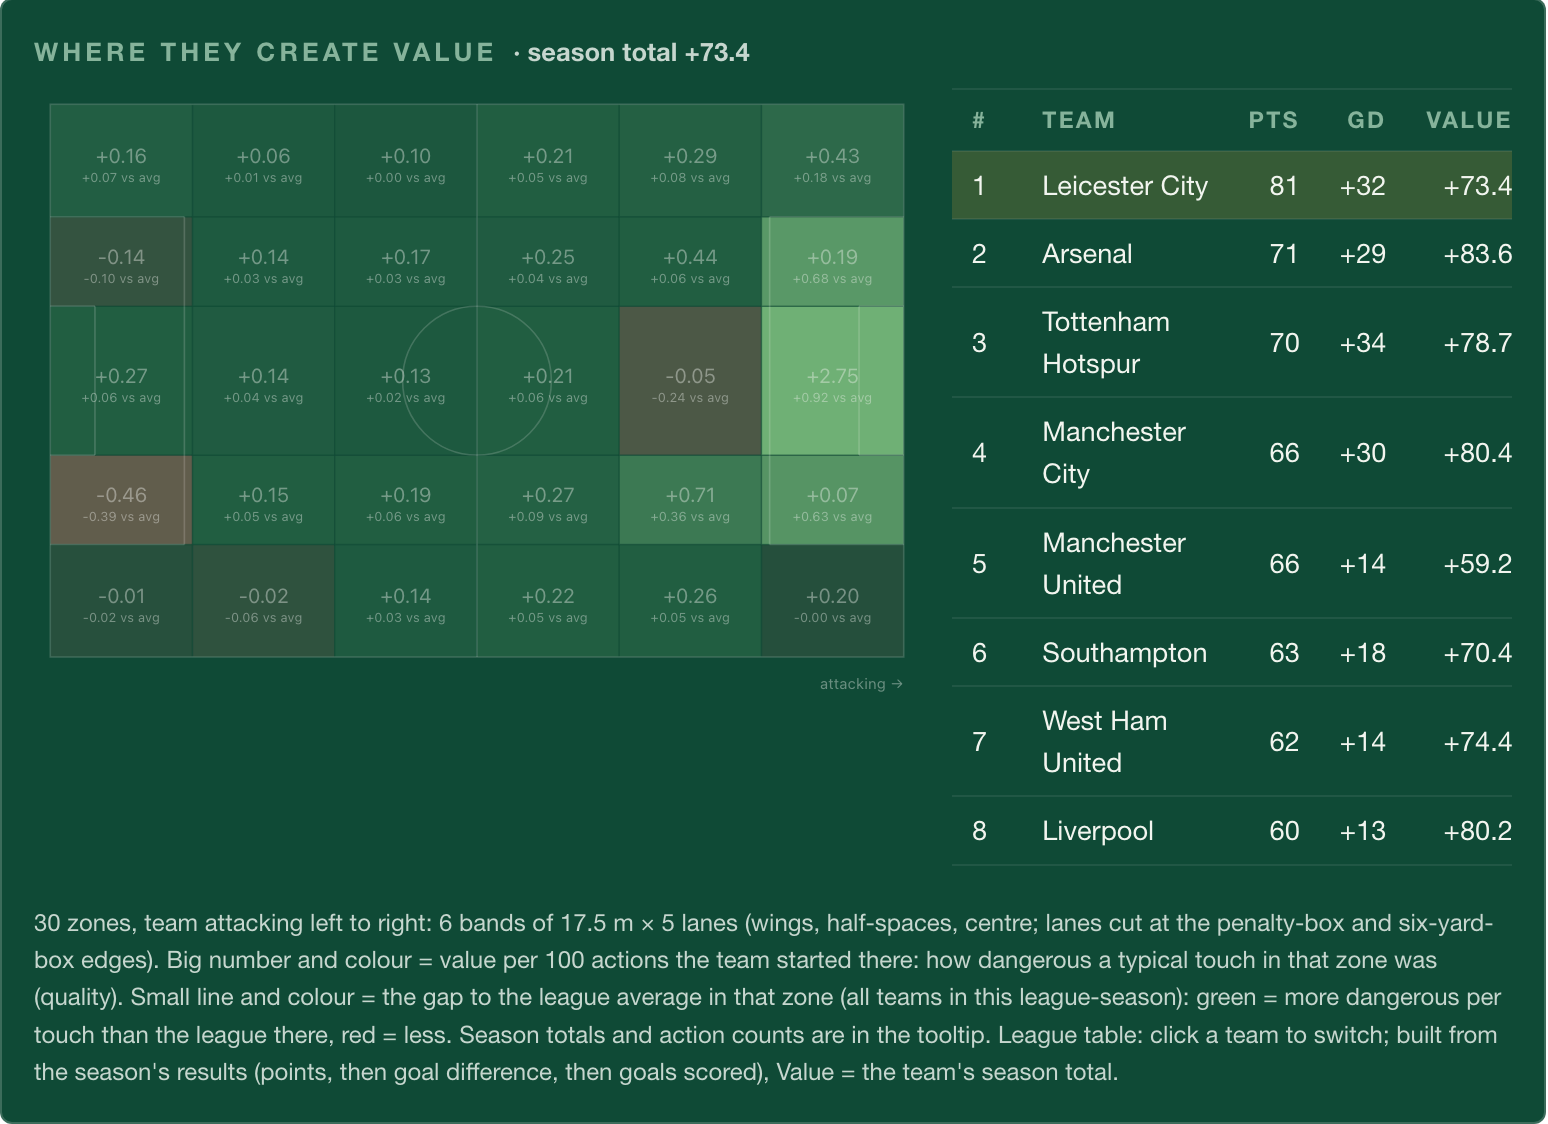 From the live dashboard. The brightest zone is straight in front of goal.
Here is Leicester across every measure:
| Leicester 2015/16 | League rank (of 20) |
|---|---|
| Points | 1st |
| Total on-ball value | 6th |
| Attacking value | 6th |
| Defensive value | 11th |
| Touches of the ball | 18th |
| Value per touch | 1st |
A season total rewards teams that have the ball a lot. Leicester didn't. They were 18th for touches. But their average touch was worth 0.234 per 100, against a league average of 0.162. Nobody was better.
Over half their value (52%) came from the final third. Only 27% of their touches happened there.
Who: every player gets a season total and a per-90 rate.
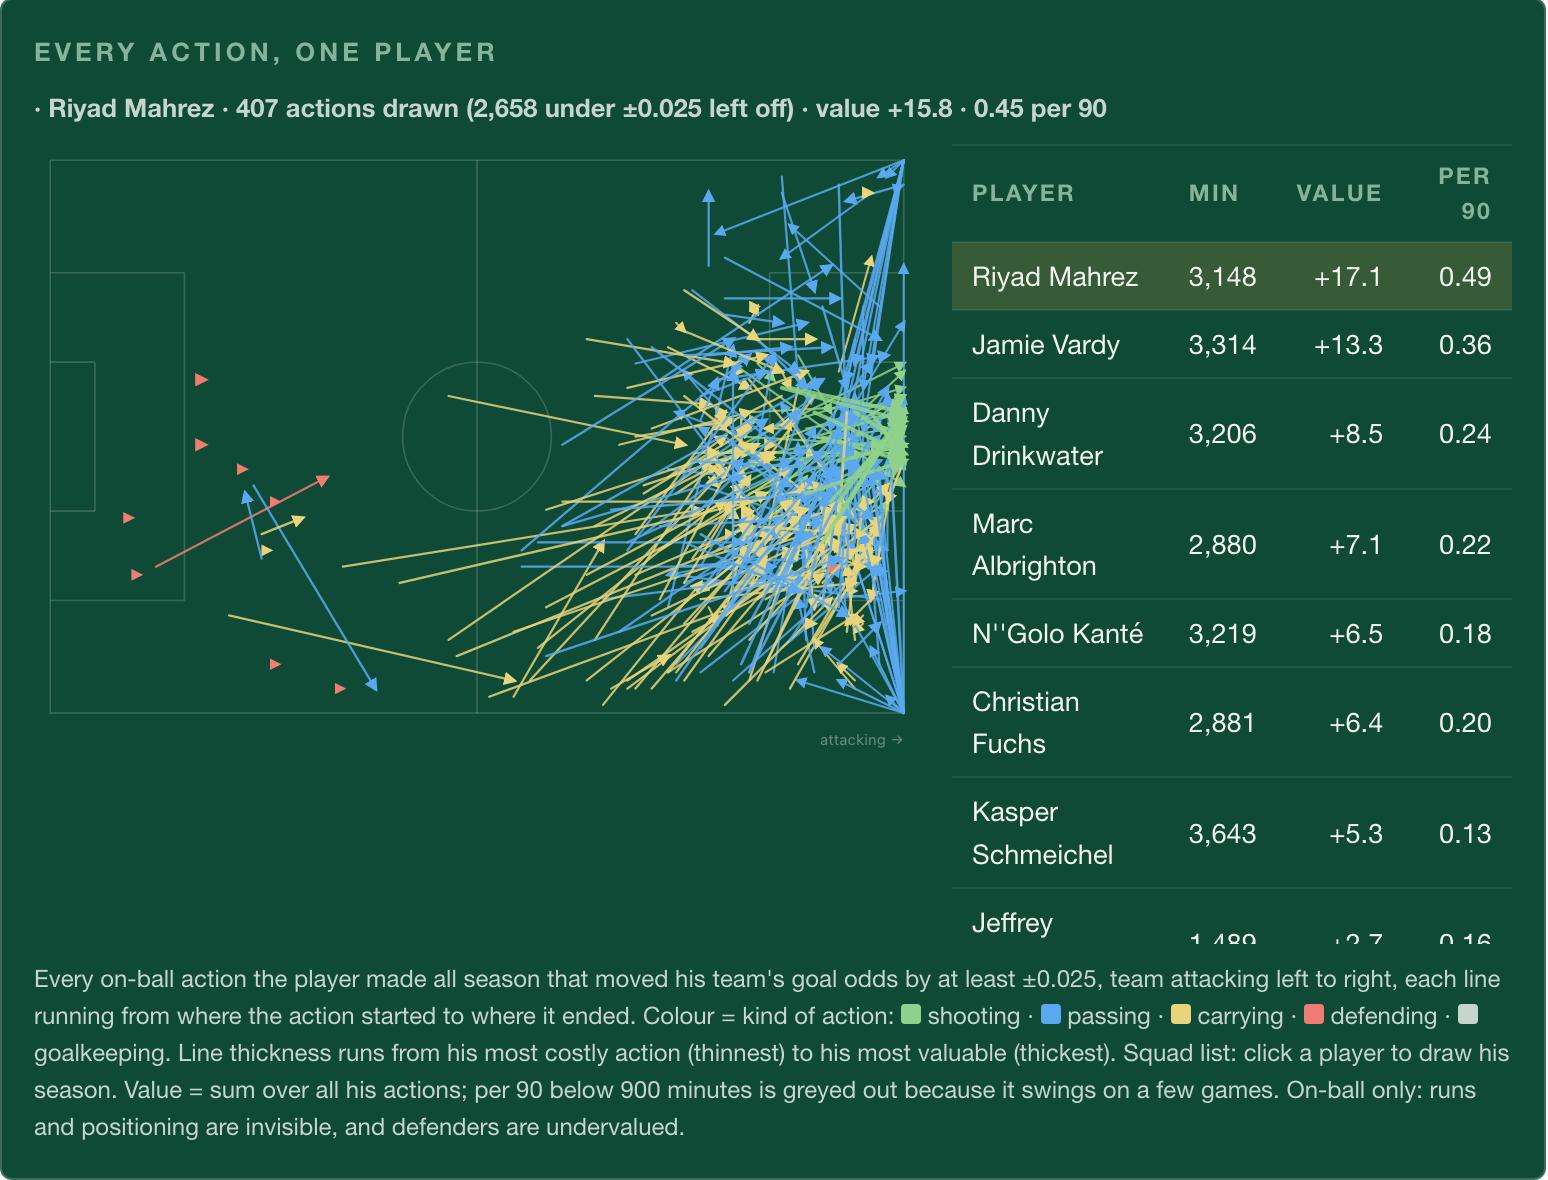 Riyad Mahrez's season. The map only draws actions worth at least ±0.025, which is why its header (+15.8) is lower than the table (+17.1).
| Player | Minutes | Value | Per 90 |
|---|---|---|---|
| Riyad Mahrez | 3,148 | +17.1 | 0.49 |
| Jamie Vardy | 3,314 | +13.3 | 0.36 |
| Danny Drinkwater | 3,206 | +8.5 | 0.24 |
| N'Golo Kanté | 3,219 | +6.5 | 0.18 |
Mahrez and Vardy are clearly top tier. Given the reliability check, I wouldn't argue about the order between them.
Leicester's top three players produced 53% of the team's value. That's the highest share in the league. The median was 37%.
A season's value also lives in a few touches. Mahrez made 3,065 actions. His 407 biggest, about 13%, account for +15.8 of his +17.1.
Kanté is the reminder of what the model can't do. The player most often credited with Leicester's defending ranks fifth in the squad. VAEP only sees the ball. It can't see a press that forces a bad pass, a gap covered, or a run that drags a defender away.
Phase 9: Try to break the finding
"First on value per touch" is a surprising result, so I tried to break it. I tested the three explanations that could make it fake.
| Could it be... | Test | Result |
|---|---|---|
| Where they played? | Give Leicester's touches the league's average quality in each zone | 0.166 per 100, not 0.234. Location explains almost none of it |
| Fewer carries? | Drop carries, the second most common action and usually a low-value one | Still 1st (0.191 per 100) |
| Penalties? | Look at penalty value | Penalties lowered Leicester's value overall |
The lead is real. One more thing came out of the testing. Leicester weren't the best at any single action. They were third on value per pass and fourth per shot.
The difference is the mix. More of their touches were the dangerous kind:
- Shots: 1.6% of their actions, against a league average of 1.2%.
- Tackles: 2.8%, against 2.0%.
- Fewer short carries and passes.
That's the shape of a team that wins the ball and goes forward quickly.
So how did Leicester win?
Here's what the data can explain. Leicester were the most dangerous team in the league per touch. They turned a quarter of their touches into half their threat. They leaned on three players more than any other team did. That's a real, measurable style, and the model sees it.
Here's what it can't. All of that still only adds up to sixth.
The model ranks Leicester 11th for defensive value, yet they conceded 36 goals, one of the four lowest totals in the league. It ranks Arsenal first, and Arsenal finished ten points behind.
That gap is the unknown variable. It isn't hiding in a column I forgot to check. It lives in the parts of the game event data doesn't record: shape without the ball, the distances between players, and the runs that never become a touch. The model can tell me where the missing explanation lives. It can't tell me what it is.
Leicester aren't the model's only miss. Manchester United finished fifth and rank 11th by value, an even bigger gap. Any team whose strength is off the ball will look worse here than in the table. Leicester is the case where that gap decided a title.
What can other teams learn from Leicester?
The data can't explain the whole title. But it does say a few things a club could use:
- Possession isn't the goal. Leicester were 18th for touches and 1st for value per touch.
- Depending on a few players works, but it's a risk. Three players produced 53% of Leicester's value, more than at any other club.
- Don't judge defending by on-ball numbers alone. The model ranks Leicester 11th for defensive value, yet they had one of the four best defences in the league.
The final lesson: more of their touches were the dangerous kind. Leicester weren't the best at any single action. They shot more often, tackled more often, and wasted fewer touches on short carries and passes. Other teams can't copy what the data can't see, but they can copy that.
What it can't tell you
What this taught me
I set out to measure why Leicester won. The most useful thing the model did was show me exactly which part of the answer isn't in the data.
So I'm curious: when your model and the result disagree, how do you decide whether it's the model or the game?
Frequently asked questions
What is VAEP?
VAEP (Valuing Actions by Estimating Probabilities) gives every on-ball action a value. The value is how much the action changed the team's chance of scoring soon, minus how much it changed the chance of conceding soon. "Soon" means within the next 10 actions.
What is SPADL?
SPADL is a standard format for football event data. It turns every event, from any provider, into one row: the action type, the player, start and end location, and whether it worked. A model built on SPADL works with any provider that can be converted to it.
Why did VAEP rank Leicester sixth when they won the league?
A season total adds up every touch, so teams with more of the ball collect more value. Leicester were 18th for touches. They ranked sixth on total value despite being first on value per touch. The rest of the gap sits in off-ball defending and movement, which event data doesn't record.
Is Leicester's lead on value per touch real?
It survives the three obvious tests. With league-average quality in the same pitch zones, Leicester would have scored 0.166 per 100 touches, not 0.234. Without carries, they still rank first. Penalties lowered their value rather than raising it.
Why compare with Manchester City 2017/18?
They're a champion that dominated the ball, so the model should agree with the table, and it does: first on points, value and touches. The two seasons use different data providers (StatsBomb and Wyscout), so only ranks are compared, never raw values.
Why is N'Golo Kanté rated so low?
VAEP only values actions on the ball. Much of a defensive midfielder's work happens off it: pressing, covering space, blocking passing lanes. A low on-ball value for a defensive player is a known blind spot of the method, not a verdict on the player.
How reliable are the player rankings?
Moderately. A player's value per 90 in one half of the season correlates 0.313 with the other half, across 293 players. That supports tiers (top, middle, bottom), not exact ranks.
Which tools did I use?
Python, socceraction for the SPADL conversion and VAEP, XGBoost as the model, scikit-learn for the validation checks, and StatsBomb's open data. The dashboard is a static site reading exported JSON.