One page per player. What each part of my scouting dashboard tells you.
I built a player dashboard to answer one scouting question, is he producing for what he costs? Here is every component, why it's drawn the way it is, and where it stops being trustworthy.
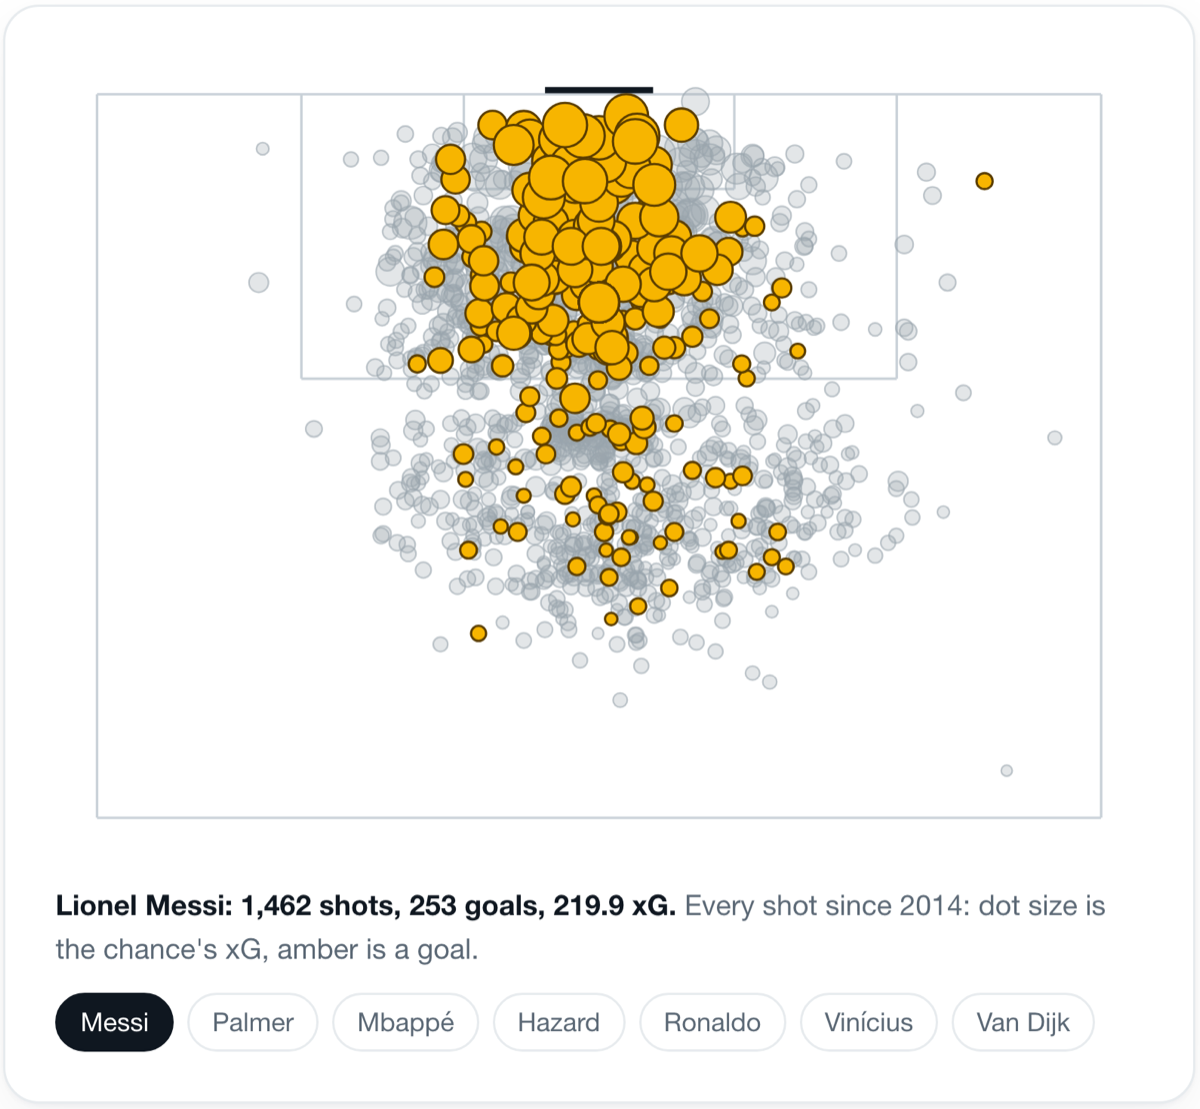
A scout looking at a player usually has one question behind all the others. Is he producing for what he costs?
I built a dashboard that tries to answer that on one page. You search a name, and you get a card for that player across every season in the big five leagues since 2008. It runs entirely on free, open football data from FBref, Understat and Transfermarkt, joined into one database. The code is public on GitHub.
This post walks through every part of that page. What each component shows, why I drew it that way, and what it can't tell you. I'll use two players the whole way through:
- Maxim De Cuyper, a 26-year-old Belgian wing-back who joined Brighton in 2025.
- Bruno Fernandes, Manchester United's 32-year-old captain and creator.
They make a useful pair. One is cheap and new to the league, the other is established and expensive. And the dashboard's verdicts on them say as much about the dashboard as about the players.
How is the page laid out?
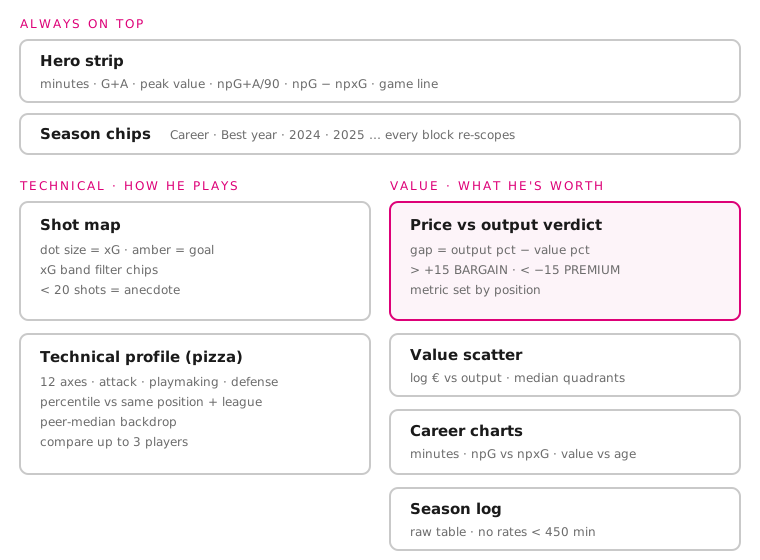 The whole page on one diagram.
The page has two layers.
The top layer never changes: a hero strip with career numbers, and a row of season chips. Below it sit two tabs. Technical shows how the player plays. Value shows what he's worth against what he produces.
I split it into two tabs because they answer two different questions. A scout watching style wants shots and passing. A recruitment lead pricing a deal wants value against output. Putting both on one long scroll made each harder to find.
The whole page is one HTML file with plain JavaScript and no chart library. Every chart is drawn as SVG by hand. That cost me more time up front, but it meant every axis, label and caption says exactly what I want it to, and nothing ships that I didn't decide on.
What does the hero strip tell you in five seconds?
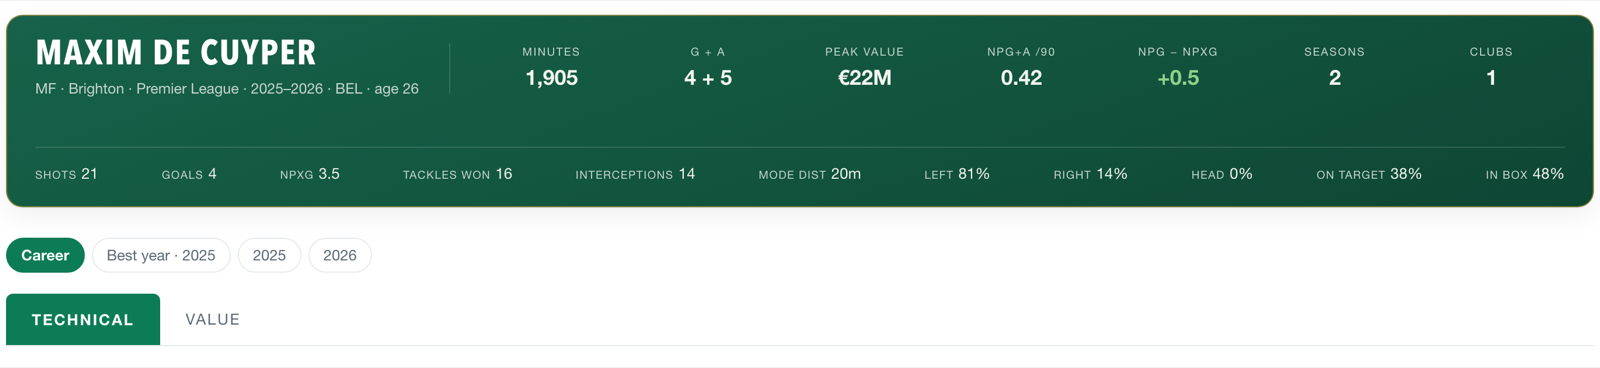 De Cuyper's career strip. The second line is the "game line": how he shoots, not just how much.
The first row is the career at a glance: minutes, goals and assists, peak market value, non-penalty goals and assists per 90, seasons and clubs.
Two numbers in it are deliberate.
npG+A /90 removes penalties and divides by minutes. Penalties go to whoever takes them, not whoever plays best, and totals reward players who simply played more. Per 90 puts a starter and a squad player on the same footing.
npG − npxG is goals minus the goals his chances were expected to produce. It's coloured green above zero and red below. De Cuyper sits at +0.5, Bruno at −0.9 over a much longer career. I show it, but I never rank on it. One season of finishing is mostly luck. It only means something over a long run.
The second row is the game line. Modal shot distance, foot split, shots on target, share of shots inside the box. De Cuyper's tells you a lot quickly: 81% left foot, 0% headers, a typical shot from 20 metres. That's a left wing-back who shoots from the edge of the area, before you've opened a single chart.
Why do the season chips matter so much?
Under the strip is a row of chips: Career, Best year, and one chip per season.
Every block on the page re-scopes to the chip you pick. Pick 2025 and the shot map, the percentiles and the verdict are all for 2025. Pick Career and the Technical tab covers everything since 2014, when shot data starts.
Best year is a shortcut. It picks the season with the highest npG+A per 90, but only among seasons with at least ten full 90s. Without that floor, a striker's best year would be the season he scored twice in 200 minutes.
The chip also lives in the URL, along with the tab and any compared players. A scout can send a colleague the exact view they're looking at, not just the player.
How do you read the Technical tab?
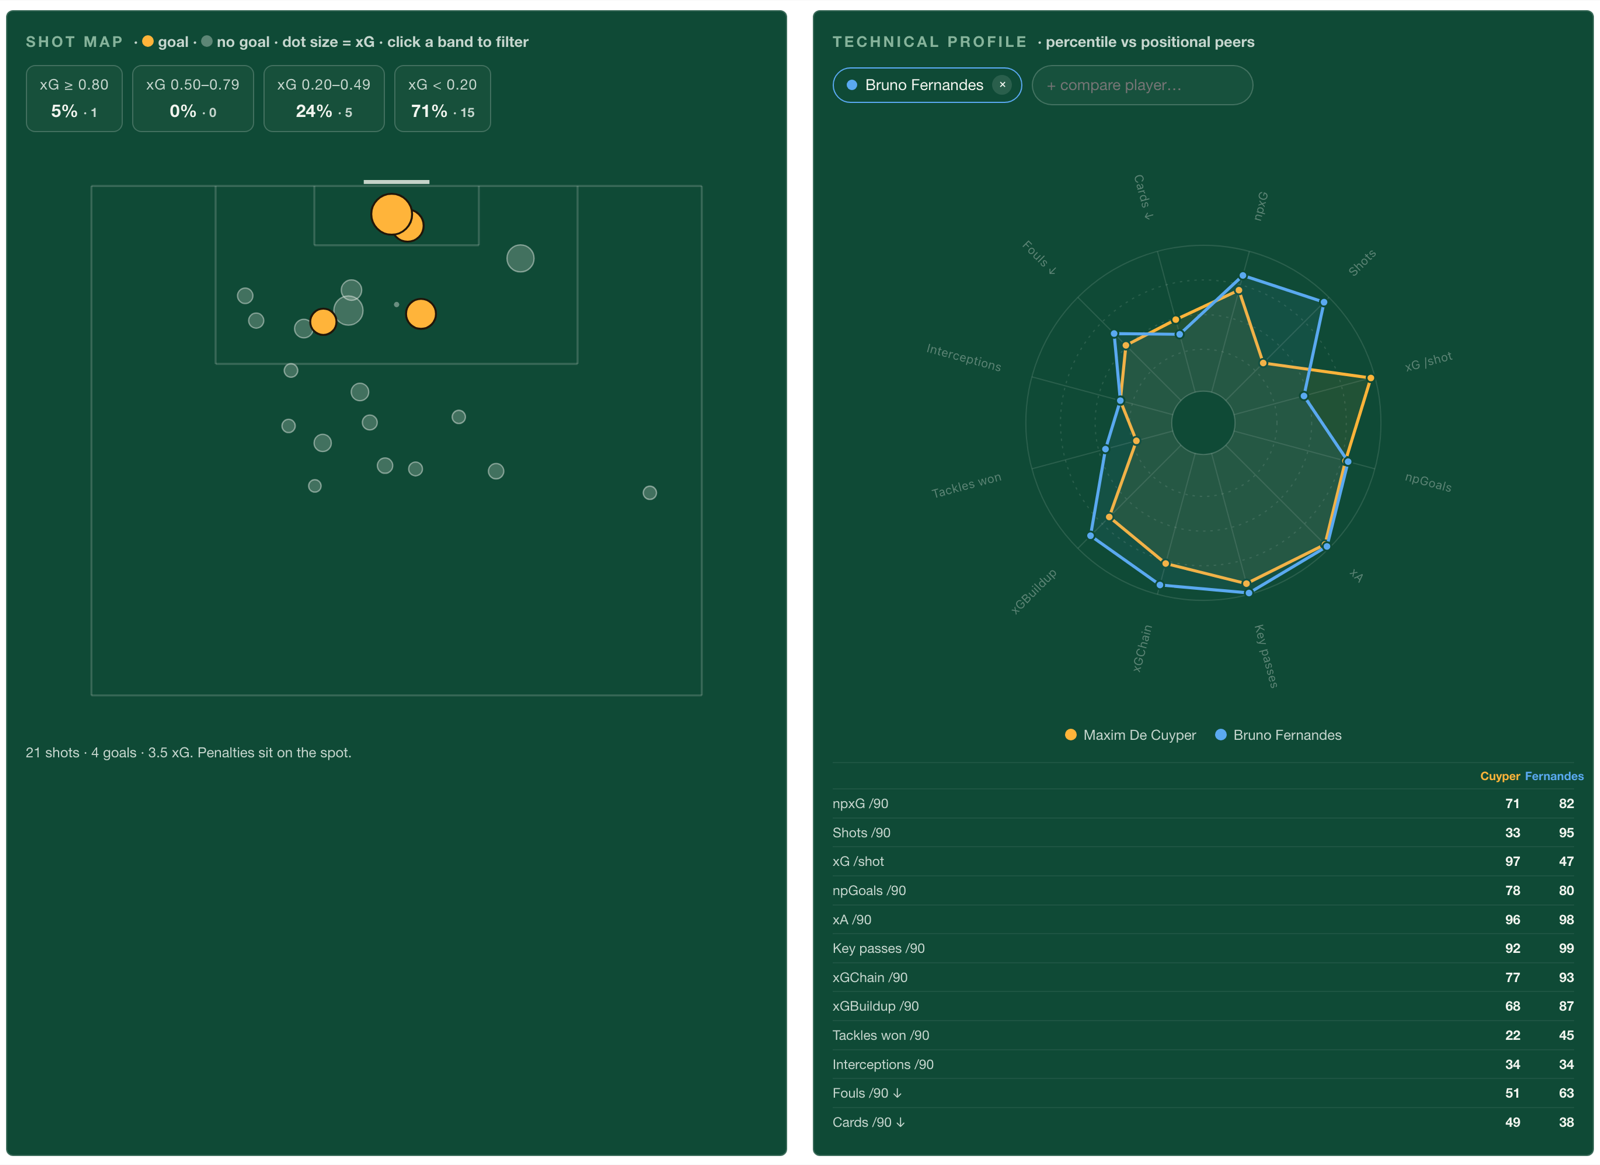 Technical tab, career view, with Bruno Fernandes added as a comparison.
The shot map
Every shot is a dot on a half pitch. Dot size is xG, the chance quality. Amber means goal.
Above the map are four xG band chips: 0.80 and up, 0.50 to 0.79, 0.20 to 0.49, and under 0.20. Each shows its share of shots and its count. Click one to filter the map to just those shots.
The bands exist because a shot map hides its own distribution. Twenty small dots look like activity. The chips say what they are. For De Cuyper, 71% of his shots are under 0.20 xG, and only one of his shots here has been worth 0.80 xG or more.
Below 20 shots, the map says it's an anecdote, not a pattern. De Cuyper has 21, so read his with care.
The technical profile (pizza)
The pizza has 12 axes in three groups:
| Group | Axes | What to keep in mind |
|---|---|---|
| Attack | npxG, shots, xG per shot, npGoals (per 90) | Shot volume depends on the team |
| Playmaking | xA, key passes, xGChain, xGBuildup (per 90) | xGBuildup credits everyone in a move equally |
| Defense & discipline | tackles won, interceptions, fouls, cards (per 90) | Volume, not quality |
Each axis is a percentile against players in the same position and league, with at least ten full 90s. A wedge at 90 means he beats 90% of his positional peers on that stat.
A few decisions sit under that:
- Same position only. A centre-back's shots per 90 against strikers' shots per 90 tells you nothing.
- Fouls and cards are flipped. Fewer is better, so a full wedge always means "good" and the shape reads one way.
- Rates come from summed totals. A career view adds up all shots and all minutes, then divides. Averaging season rates would let a 400-minute season count as much as a 3,000-minute one.
- A grey peer-median shape sits behind the player. It shows what "normal" looks like without a second chart.
Comparing two players
Add up to three players and they overlay on one pizza. Comparisons always switch to Career and rank everyone against the same peer pool. If each player was ranked against their own pool, the same wedge length would mean different things.
Here, both are ranked among Premier League midfielders:
| Axis | De Cuyper | Bruno |
|---|---|---|
| xG per shot | 97 | 47 |
| xA per 90 | 96 | 98 |
| Key passes per 90 | 92 | 99 |
| Shots per 90 | 33 | 95 |
| Tackles won per 90 | 22 | 45 |
The shapes are close on creating chances. De Cuyper is near Bruno's level on expected assists. They split on shooting. Bruno shoots from everywhere, at high volume and lower quality. De Cuyper shoots rarely, and when he does the chance is good.
That's a real scouting read, and it came from one overlay.
How does the verdict card decide Bargain or Premium?
The Value tab opens with the card the whole page was built around.
It ranks the player's output against his positional peers for one season. Then it ranks his market value against the same peers. The verdict is the gap between the two percentiles:
gap = output percentile − value percentile
- More than +15: BARGAIN. He produces more than his price suggests.
- Less than −15: PREMIUM. He costs more than he produces.
- In between: FAIR VALUE.
I compared percentiles, not euros, so price and production sit on the same 0–100 scale. A €40M midfielder and a 0.76 goals-and-assists rate can't be subtracted. Their ranks can.
The output metric changes by position, because "output" means different things:
| Position | Output metric |
|---|---|
| Forward, midfielder | npG+A per 90 |
| Defender | tackles + interceptions per 90 |
| Goalkeeper | save % |
Under the verdict sit the bars that defend it: expected output (npxG+xA), availability, start share, cards as literal booking-card dots, and value. The page also refuses to give a verdict when it shouldn't. Under 450 minutes it says TOO FEW MINUTES. With no market value or too small a peer pool, it says so instead of guessing.
Bruno: a Bargain at 32
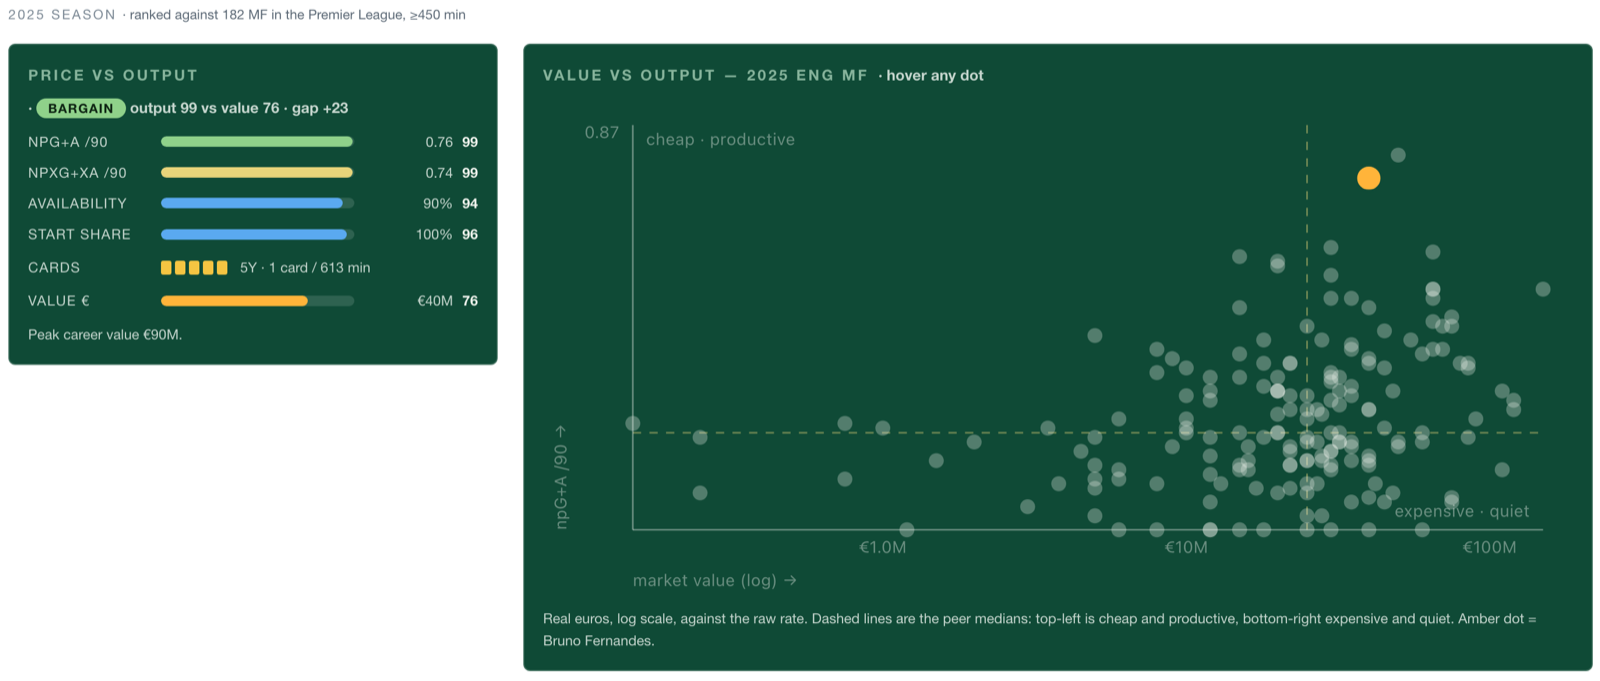 Bruno, 2025/26, ranked against 182 Premier League midfielders.
Bruno's 2025/26 output ranks 99th among Premier League midfielders. His €40M value ranks 76th. Gap +23: BARGAIN.
The bars back it up. His expected output is also 99th, so this isn't a hot finishing streak. He played 90% of the minutes available and started every game he appeared in.
De Cuyper: a Premium, and why that's a warning
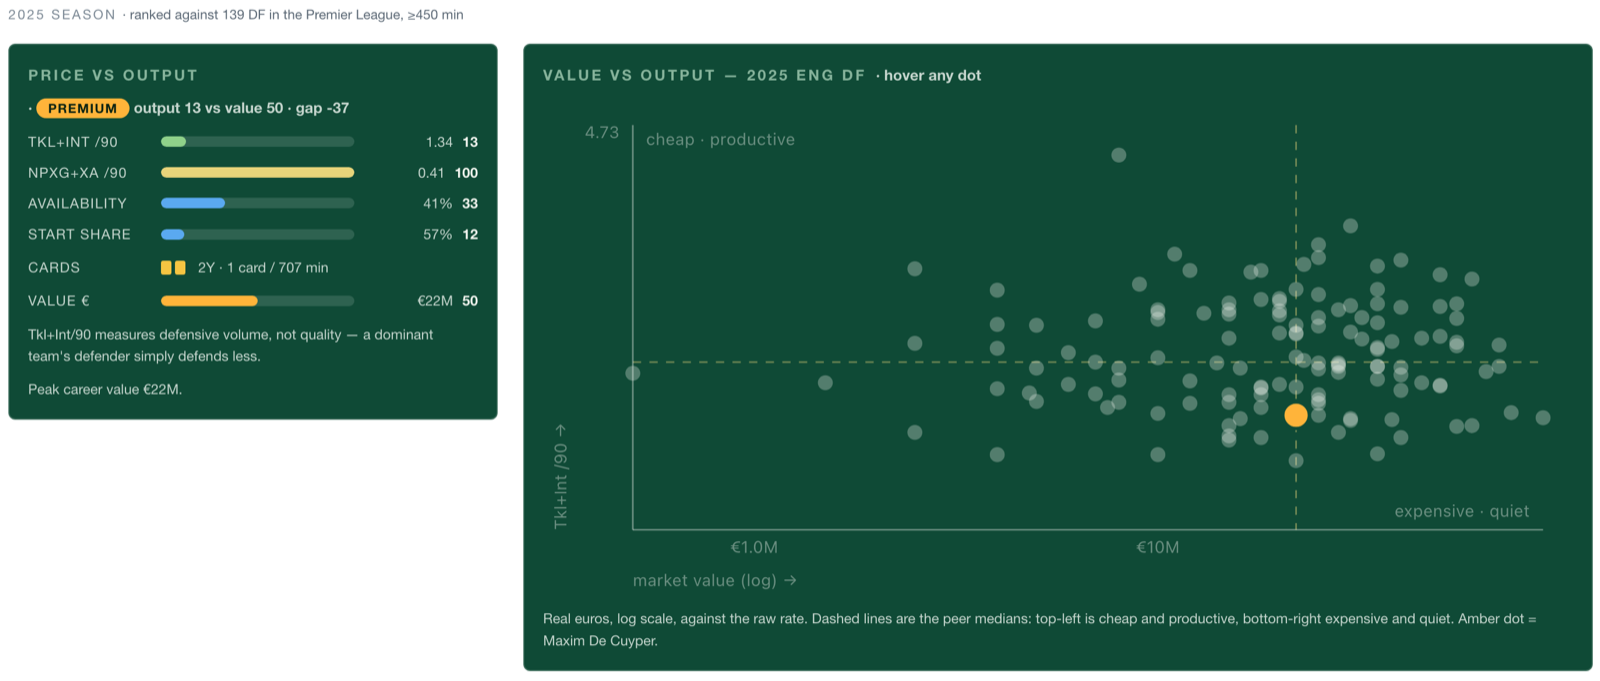 De Cuyper, 2025/26, ranked against 139 Premier League defenders.
De Cuyper is listed as a defender for 2025/26. So the card judges him on tackles and interceptions, and there he ranks 13th. His €22M value ranks 50th. Gap −37: PREMIUM.
Now look one bar down. His expected goals and assists per 90 rank 100th among Premier League defenders. No defender in the league created more.
The verdict is only as good as the metric the position hands it. For a wing-back who attacks, tackles and interceptions is the wrong question. The card prints that limit right under the bars: "Tkl+Int/90 measures defensive volume, not quality." That's why the expected-output bar sits under every verdict. When the two disagree this much, the scout should look again before trusting the label.
What does the value scatter add?
Next to the verdict is a scatter of the whole peer pool. Market value runs along the bottom, the output rate up the side. The player is the amber dot.
Two dashed lines mark the peer medians and split the chart into four corners. Top-left is cheap and productive. Bottom-right is expensive and quiet. Quadrants need no regression line to read. Anyone can see which corner a dot is in.
The value axis is a log scale. Market value is very skewed, with a few players worth ten times the median. On a normal axis, the cheap half of the league would be squashed into a strip by the left edge, and that's where scouts most want to look.
What do the career charts show?
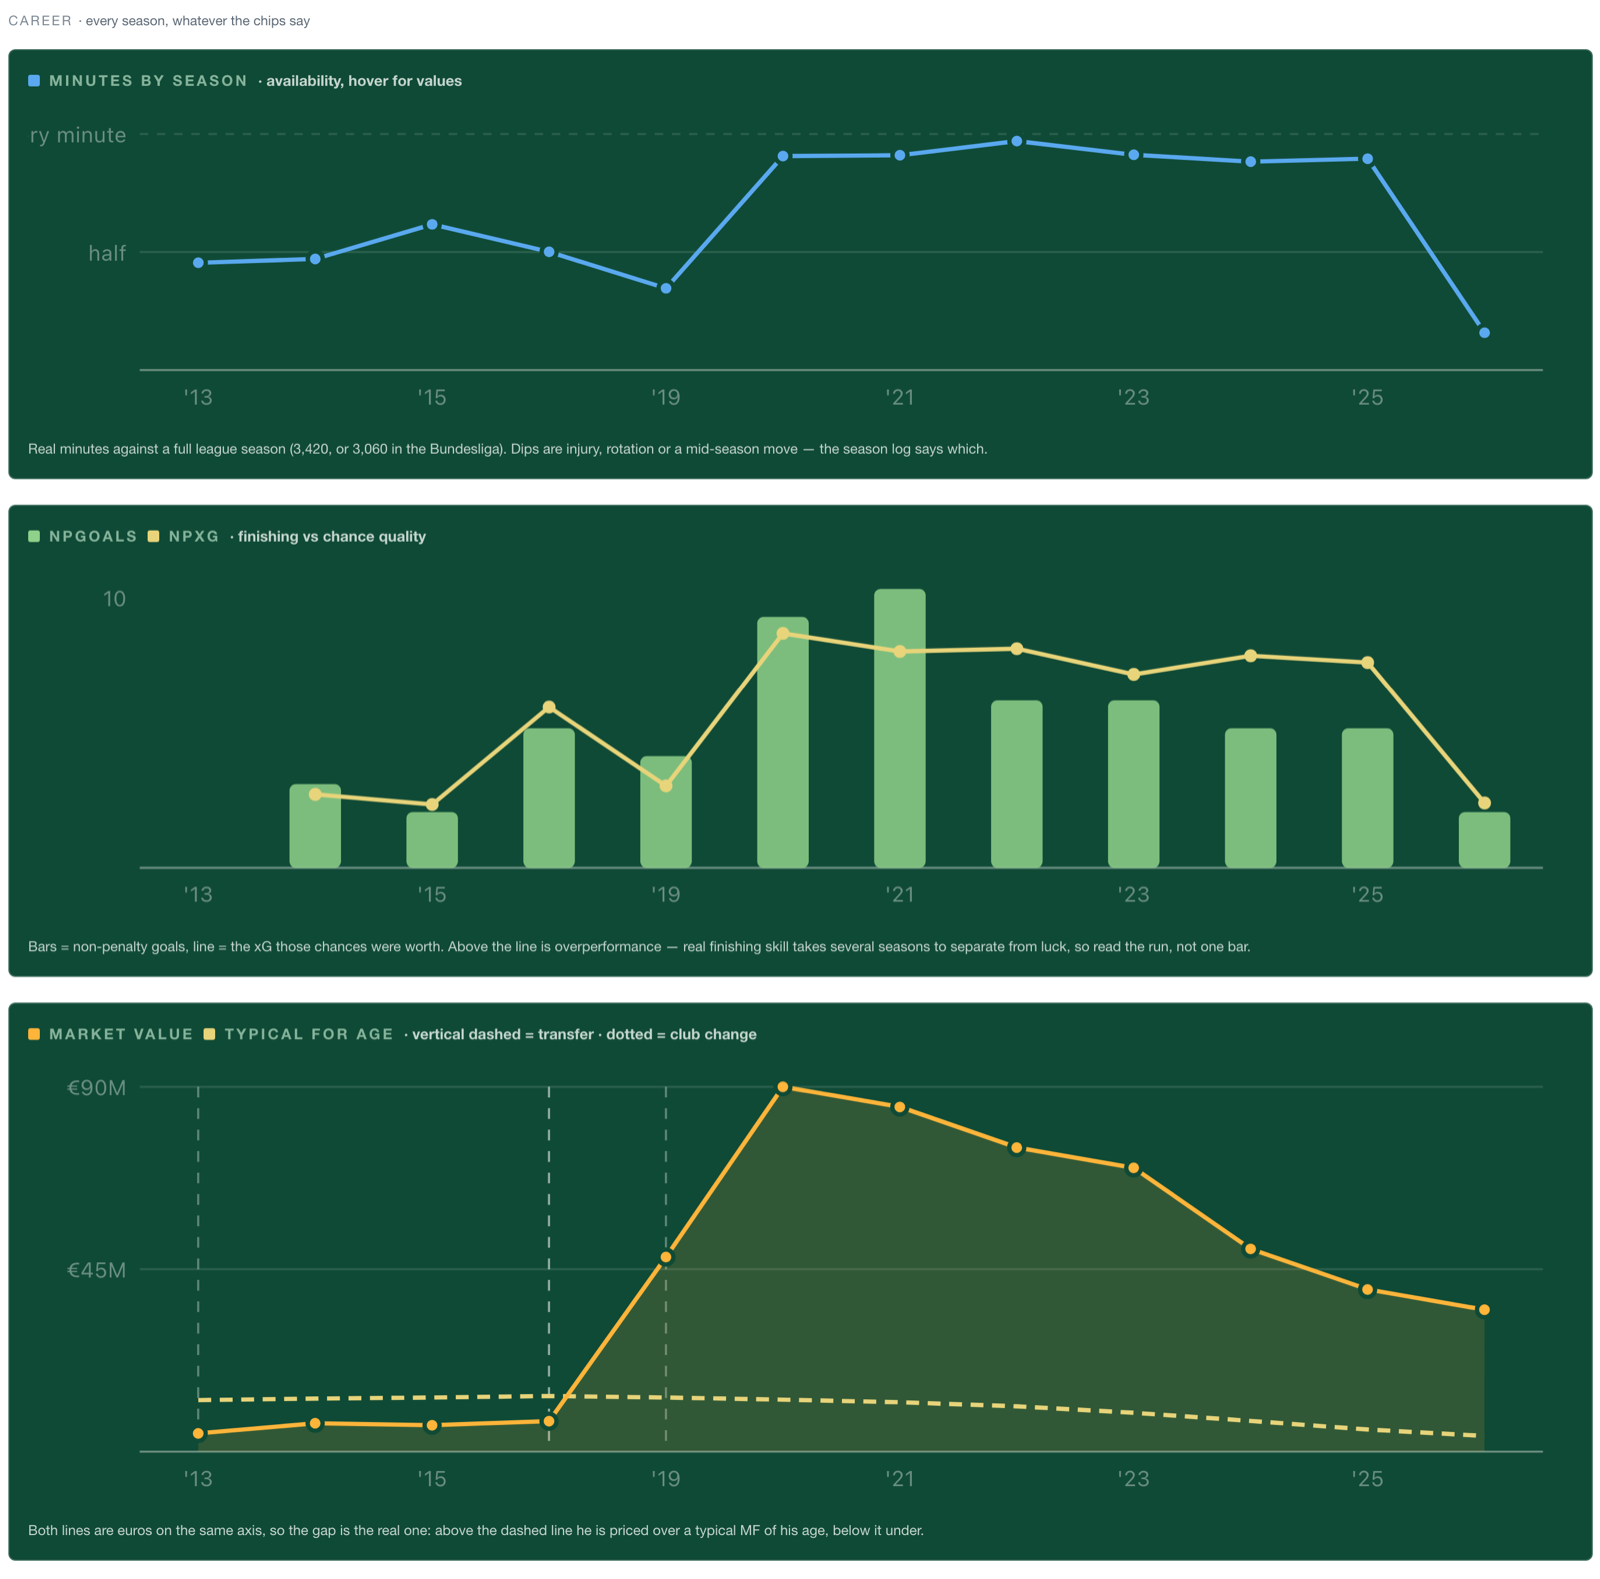 Bruno's career. Note the gap between 2016 and 2019: his Sporting years are outside the big five.
Below the season view, three charts cover the whole career, whatever the chips say.
Minutes by season plots minutes against a full league season. Dips are injury, rotation or a mid-season move. Bruno has been close to every minute since 2020.
npGoals vs npxG shows goals as bars and the expected goals of his chances as a line. Above the line means finishing better than expected. The caption says read the run, not one bar, because one season of finishing is mostly variance.
Market value vs typical for age puts the player's value next to the average value of players in the same position at each age, on the same euro axis. I kept both lines in real euros so the gap between them is the real gap. Vertical dashed lines mark transfers. Dotted lines mark club changes the transfer data missed, so a move never disappears just because the record does.
Bruno's chart tells the story of a peak. His value rose to €90M in 2020 and has fallen every year since, to €40M. It's still far above what a typical 32-year-old midfielder is worth. That falling price, with output still at the 99th percentile, is exactly why the verdict reads Bargain.
At the bottom is a season log: raw minutes, goals, assists and value for every season. Rates under 450 minutes show as a dash, not a number. Valuations more than a year old at season end get a ⚠.
What rules does every number follow?
A few rules run through the whole page. They're the reason two numbers on screen can be trusted next to each other.
| Rule | Why |
|---|---|
| Percentiles use the midrank for ties | If a whole pool is tied, everyone reads 50, not 0 |
| A pool under 8 players ranks nothing | A percentile out of five players is noise |
| No rates under 450 minutes | Small samples swing too much to rank |
| Career rates use summed totals | Long seasons count more than short ones |
| Comparisons share one peer pool | The same wedge length means the same thing |
| Each position's metric states its limit | The reader sees the caveat next to the number |
What can't it see?
The dashboard is honest about three blind spots, and you should know them before using it.
- Defending is counted, not judged. Tackles and interceptions count events. A defender on a dominant team simply defends less, and the best defending, being in the right place so nothing happens, leaves no event at all.
- Save % ignores shot difficulty. A keeper facing easy shots looks better than one facing hard ones. A difficulty-adjusted measure is the next step.
- Coverage is the big five only. De Cuyper's Club Brugge years and Bruno's Sporting years aren't here. Anyone joining from outside those leagues arrives with a short history.
The short version
The dashboard answers one question: is this player producing for what he costs?
The Technical tab shows how he plays, ranked against his positional peers. The Value tab turns output and price into percentiles and gives a verdict on the gap. Every chart has a caption that says what it can't show.
Bruno Fernandes comes out a Bargain. De Cuyper comes out a Premium, while creating more than any defender in the league. That second result is the most useful thing on the page. It shows exactly where the card's logic ends and the scout's judgement has to start.
Open the dashboard and try your own player →
Frequently asked questions
Is the dashboard built on open data, and is the code public?
Yes to both. Every number comes from free, open football data: season stats from FBref, xG and shots from Understat, and market values and transfers from a public Transfermarkt dataset. No paid provider is involved. The code for the dashboard and the data pipeline is public on GitHub.
Can I use this dashboard to find players, or only to check one?
Only to check one. It evaluates a player you already have in mind: search a name, read the card. It doesn't filter the league for "cheap and productive under 24". The value scatter shows the whole peer pool, so you can hover across it, but there are no search filters yet.
Which leagues and seasons does it cover?
The big five: Premier League, La Liga, Serie A, Bundesliga and Ligue 1. Season stats and market values start in 2008/09. Shot-level data (xG, shot maps, the pizza) starts in 2014/15. Players arriving from other leagues, like De Cuyper from Belgium, show only their big-five seasons.
Can I compare players from different leagues?
You can overlay them, but read it with care. A comparison ranks every player against the first player's league and position pool. Rates from another league are not adjusted for league strength, so a Serie A season and a Premier League season are treated as equal.
Why did a wing-back come out as Premium?
The verdict uses one output metric per position, and De Cuyper was listed as a defender. Defenders are judged on tackles plus interceptions, where he ranks 13th. His expected goals and assists rank 100th among defenders. When the verdict and the expected-output bar disagree this much, trust the bars and look at his role.
How is the Bargain or Premium verdict calculated?
It ranks the player's output and his market value against the same peers for one season, then subtracts: output percentile minus value percentile. Above +15 is Bargain, below −15 is Premium, in between is Fair value. The ±15 band is a fixed threshold, so a gap near it is a close call.
Where do market values come from, and how fresh are they?
Transfermarkt, through a public dataset. They are crowd-sourced estimates, not transfer fees. The season log marks any valuation more than a year old at season end with a ⚠, because an old value makes the verdict less reliable.
Does it include wages, contracts or injuries?
No. None of those are in the data. Availability (share of possible minutes) and start share are the closest proxies for fitness and trust from the coach, and the minutes chart shows the dips. Why a player missed time has to come from somewhere else.
How much data does a player need before I can trust the numbers?
Rates and verdicts need at least 450 minutes in a season. Pizza peers need ten full 90s. Any percentile needs a pool of at least eight players. A shot map with fewer than 20 shots is flagged as an anecdote. Below those floors, the page shows a dash or a message instead of a number.